Aging Is Not Uniform Across the Body. A New Study Maps It at the Level of Individual Cell Types
Prefer to listen? Hit play for a conversational, audio‑style summary of this article’s key points.
Aging is not uniform across the body. Different cell types age at different rates within the same individual, and two people with identical chronological ages and identical composite biological age scores can have dramatically different cellular aging profiles. A new study from Stanford's Wyss-Coray Lab demonstrates that this cellular-level aging heterogeneity is not just biologically real but clinically consequential, predicting which specific diseases an individual will develop years before any symptom appears.
A single blood draw can now estimate the biological age of more than 40 cell types simultaneously. By mapping over 7,000 plasma proteins to their cellular origins and training machine learning models on data from more than 60,000 individuals across three independent cohorts, the study built cell type-specific biological age clocks that can be read from plasma proteomics. The models were validated across two different proteomics platforms and three independent populations, establishing that the biological signals they detect are robust rather than platform-specific artifacts.
Astrocyte aging predicts Alzheimer's disease with a hazard ratio comparable to carrying the APOE4 gene variant. Extreme astrocyte aging conferred a 12.59-fold higher risk of incident Alzheimer's disease compared to youthful astrocyte aging over 15 years of follow-up, a predictive magnitude that exceeded both the Alzheimer's polygenic risk score and chronological age. For women, the association was stronger still, with extreme astrocyte aging and APOE4 together conferring a 14-fold higher hazard ratio than normal aging without the genetic risk factor.
Youthful astrocytes appear to protect against Alzheimer's disease even in genetically predisposed individuals. Among APOE4 homozygotes with extreme astrocyte aging, 38 percent developed Alzheimer's disease over 15 years compared to 12 percent for those with normal astrocyte aging. None of the APOE4 homozygotes with youthful astrocytes developed Alzheimer's during the follow-up period. This finding, while based on a small number of individuals, suggests that astrocyte biological youth may meaningfully attenuate the expression of genetic Alzheimer's risk, making the determinants of astrocyte aging one of the most important questions in Alzheimer's prevention research.
Skeletal myocyte aging is the strongest disease-cell type association in the dataset and predicts ALS years before diagnosis. Individuals with extreme skeletal myocyte aging showed a 12.74-fold higher risk of incident ALS over 15 years, and the association persisted even when considering only cases diagnosed more than three years after the blood draw. This temporal precedence suggests that muscle tissue pathology detectable from plasma proteomics begins years before the motor neuron degeneration that defines ALS clinically, raising the possibility that early identification of extreme skeletal myocyte aging could eventually create an intervention window that currently does not exist for this disease.
The APOE4 genotype accelerates astrocyte aging while simultaneously slowing macrophage aging. APOE2 carriers show the inverse pattern. This antagonistic relationship between brain cell aging and immune cell aging across APOE genotypes provides a cellular-resolution demonstration of evolutionary antagonistic pleiotropy: the same biological properties that enhanced immune vigilance in ancestral environments may have come at the cost of accelerated brain aging that only becomes clinically relevant in modern extended lifespans. Composite biological age scores cannot capture this kind of genotype-specific cellular trade-off.
Lifestyle factors shape the cellular aging map broadly and simultaneously. Individuals with concurrent smoking and obesity showed widespread acceleration of biological age across virtually every cell type in the panel. Individuals with a healthy lifestyle defined as never smoking, regular exercise, adequate sleep, and healthy BMI showed broadly younger cellular profiles. The pattern suggests that healthspan-promoting behaviors are preserving biological youth across multiple cellular systems simultaneously rather than acting through any single biological pathway.
Cell type-specific aging predicts cancer and chronic disease with biologically coherent specificity. Respiratory epithelial cell aging identified smokers at 58 percent higher lung cancer risk than smoking history alone. Myeloid lineage aging predicted type 2 diabetes progression in both prediabetic and normoglycemic individuals. Granulocyte and B cell aging predicted lymphoma with hazard ratios exceeding those of established hematopoietic risk markers. In every disease category examined, the cell types showing the strongest predictive associations were those most directly implicated in that disease's established pathophysiology.
The cumulative burden of cellular aging across multiple cell types predicts survival in a striking dose-response pattern. Individuals with normal aging profiles maintained approximately 90 percent survival over 15 years. Those with extreme aging across more than 20 cell types showed approximately 34 percent survival over the same period. Youthful immune and neuronal cell types conferred protective effects on survival regardless of aging status in other cell types, suggesting that biological youth in specific cell populations is an active resilience factor rather than simply the absence of accelerated aging.
Cellular aging states tend to persist once established rather than spontaneously resolving. Tracking individuals over a 10-year period, the study found that 55 percent of extreme macrophage agers and 81 percent of extreme alveolar type 2 cell agers retained their extreme aging status across the follow-up period. This stability places a premium on identifying and addressing accelerated cellular aging early, before trajectories have become entrenched, and suggests that the window for intervention may be more constrained than a dynamic model of cellular aging would imply.
Introduction: The Map of Aging Just Got More Detailed
Biological age science has been built on a productive simplification. The body ages, and that aging can be detected through the patterns of molecules it leaves in the bloodstream. Combine enough of those molecular signals, train a model on a large enough population, and you can produce a single number that tells you more about how a person's biology is actually progressing than the date on their birth certificate. The Levine PhenoAge model demonstrated this was possible. The Bortz model refined it with greater precision and a larger training dataset. The organ-specific models that have emerged from this foundation extended it to the liver, the kidney, the metabolic system, asking not just how fast the whole body is aging but which organ systems are driving it.
Each of these advances increased the resolution of the map. But they all shared a foundational assumption that a new study published in Nature Medicine from Tony Wyss-Coray's laboratory at Stanford is now challenging: that aging, however precisely measured, can be adequately captured at the level of organs or composite biomarker panels. What the Stanford team has demonstrated, in a study involving more than 60,000 individuals across three independent cohorts, is that the biological age map needs to be drawn at a finer resolution still. Not organs. Individual cell types.
Aging is not uniform. It does not proceed at the same rate in every tissue, every organ, or even every cell population within a single organ. Two people of identical chronological age and identical composite biological age scores can have dramatically different cellular aging profiles, with some cell types looking decades older than expected while others look biologically young. A neuron can be aging rapidly in a brain whose overall organ age score appears unremarkable. An astrocyte population can be senescing in ways that triple the risk of Alzheimer's disease in someone whose standard laboratory markers show nothing alarming. A skeletal muscle cell population can accumulate the molecular signatures of accelerated aging years before any clinical symptom of the disease that aging predicts.
What makes this study different from its predecessors is not just the biological claim. It is the method. The team measured more than 7,000 plasma proteins in over 60,000 individuals, mapped those proteins to their cellular origins using the Human Protein Atlas, and built machine learning models that estimate the biological age of more than 40 distinct cell types from a single blood draw. They then asked a simple but consequential question: does knowing the biological age of specific cell types predict future disease better than knowing overall biological age alone? The answer, demonstrated across 15 years of follow-up data, was yes. Dramatically so.
Extreme skeletal myocyte aging predicted ALS with a 12.7-fold higher risk. Extreme astrocyte aging predicted Alzheimer's disease with a hazard ratio comparable to carrying the APOE4 gene variant. Youthful astrocytes reduced Alzheimer's risk by more than 60 percent, even in genetically predisposed individuals. Extreme respiratory epithelial aging in smokers identified lung cancer risk 58 percent higher than smoking alone. These are not marginal improvements in predictive precision. They are findings that change how aging medicine should think about risk stratification, early detection, and the specific cellular targets that interventions should be aiming at.
The map just got more detailed. Understanding what it shows is worth the effort.
Why Cells Age at Different Rates: The Biology of Asynchronous Aging
The idea that different parts of the body age at different rates is not new. Clinicians have long observed that one patient's cardiovascular system seems decades older than their chronological age while their cognitive function remains sharp, while another patient shows the reverse pattern. Organ-specific biological age models have formalized this observation, demonstrating that the liver, kidney, brain, and heart can follow distinct aging trajectories within the same individual. What this study extends is the resolution at which that asynchrony can be detected, from organs to the individual cell populations that compose them.
Understanding why cells age at different rates requires thinking about what aging actually is at the cellular level and why different cell types face different versions of that challenge.
The Cellular Aging Problem
Every cell in the body is subject to a continuous accumulation of biological insults: oxidative damage from the reactive oxygen species generated during normal energy metabolism, DNA damage from replication errors and environmental exposures, telomere shortening from repeated cell division, protein misfolding and aggregation from the gradual failure of quality control systems, and the mitochondrial dysfunction that compounds all of these over time. Cells have elaborate machinery for responding to this damage, including DNA repair systems, antioxidant defenses, autophagy, and the mitophagy system that clears dysfunctional mitochondria. But none of these systems is perfect, and none operates without cost. Damage accumulates. The rate at which it accumulates determines how quickly a cell ages.
What makes this accumulation asynchronous across cell types is that different cells face these challenges at different intensities, through different mechanisms, and with different levels of biological protection.
Cells that replicate continuously face a specific and well-characterized aging pressure that terminally differentiated cells do not. Each time a cell divides, its telomeres shorten slightly. When telomeres reach a critically short length, the cell enters senescence or dies, placing a limit on how many times it can divide. Intestinal epithelial cells, immune cells, and stem cell populations throughout the body are subject to this replicative aging pressure in ways that neurons, cardiomyocytes, and skeletal muscle fibers are not. For these long-lived, non-dividing cell types, the primary aging pressures are different: the accumulated damage of decades of metabolic activity without the renewal that replication provides, the progressive failure of protein quality control systems in cells that must maintain their function across the entire lifespan, and the vulnerability to the specific environmental and metabolic stressors their tissue context exposes them to.
Tissue context matters enormously. Respiratory epithelial cells lining the airways are exposed to inhaled toxins, particulates, and pathogens in ways that neurons protected behind the blood-brain barrier are not. Pancreatic endocrine cells producing insulin in response to continuous glycemic demands face the metabolic stress of hyperglycemia in ways that skeletal muscle cells do not until insulin resistance has already developed. Astrocytes embedded in the neuroinflammatory environment of an aging brain are bathed in the inflammatory cytokines that chronic microglial activation produces, creating an accelerating feedback between neuroinflammation and astrocyte aging that other cell types do not experience with the same intensity.
Genetic factors add a further layer of cell type-specificity to aging rates. The APOE4 variant, which increases Alzheimer's disease risk through its effects on amyloid clearance, lipid metabolism, and neuroinflammatory signaling, turns out to accelerate aging specifically in astrocytes while simultaneously slowing aging in macrophages. This antagonistic pattern, visible at cellular resolution in the study's data, suggests that genetic variants can shape the aging landscape of specific cell populations in ways that composite organ-level scores obscure entirely.
The practical implication of cellular aging asynchrony is that individuals at identical composite biological ages can be at dramatically different risk profiles depending on which specific cell populations are aging fastest in their bodies. Two people with the same Bortz biological age score may have completely different cellular aging maps: one with accelerated astrocyte aging and preserved skeletal muscle biology, another with youthful brain cell populations but rapidly aging lung epithelium. The diseases they are most vulnerable to, the interventions most likely to benefit them, and the time window in which preventive action is most effective will all differ in ways that composite biological age scores cannot capture.
This is the fundamental insight that drives the study's methodology and its findings. Biological age at cellular resolution is not simply a more precise version of biological age at composite resolution. It is a qualitatively different kind of information, one that maps individual vulnerability with a specificity that composite scores, however well calibrated, cannot provide. The question the study had to answer was whether that cellular-resolution information could be extracted from something as accessible and scalable as a blood test. The answer required solving a significant methodological challenge.
The Study: Reading Cell Type-Specific Aging From a Blood Test
The central methodological challenge this study had to solve was deceptively simple to state and technically demanding to execute: how do you measure the biological age of specific cell types in a living person without obtaining tissue samples from each of those cell types directly? A muscle biopsy can tell you something about the biological state of skeletal muscle cells. A lumbar puncture can provide information about the cerebrospinal fluid environment surrounding neurons and astrocytes. But neither approach is scalable to tens of thousands of individuals, and neither provides simultaneous information about 40 different cell types from a single procedure.
The solution the Stanford team developed exploits two features of human biology that, combined with modern proteomics technology, make the problem tractable.
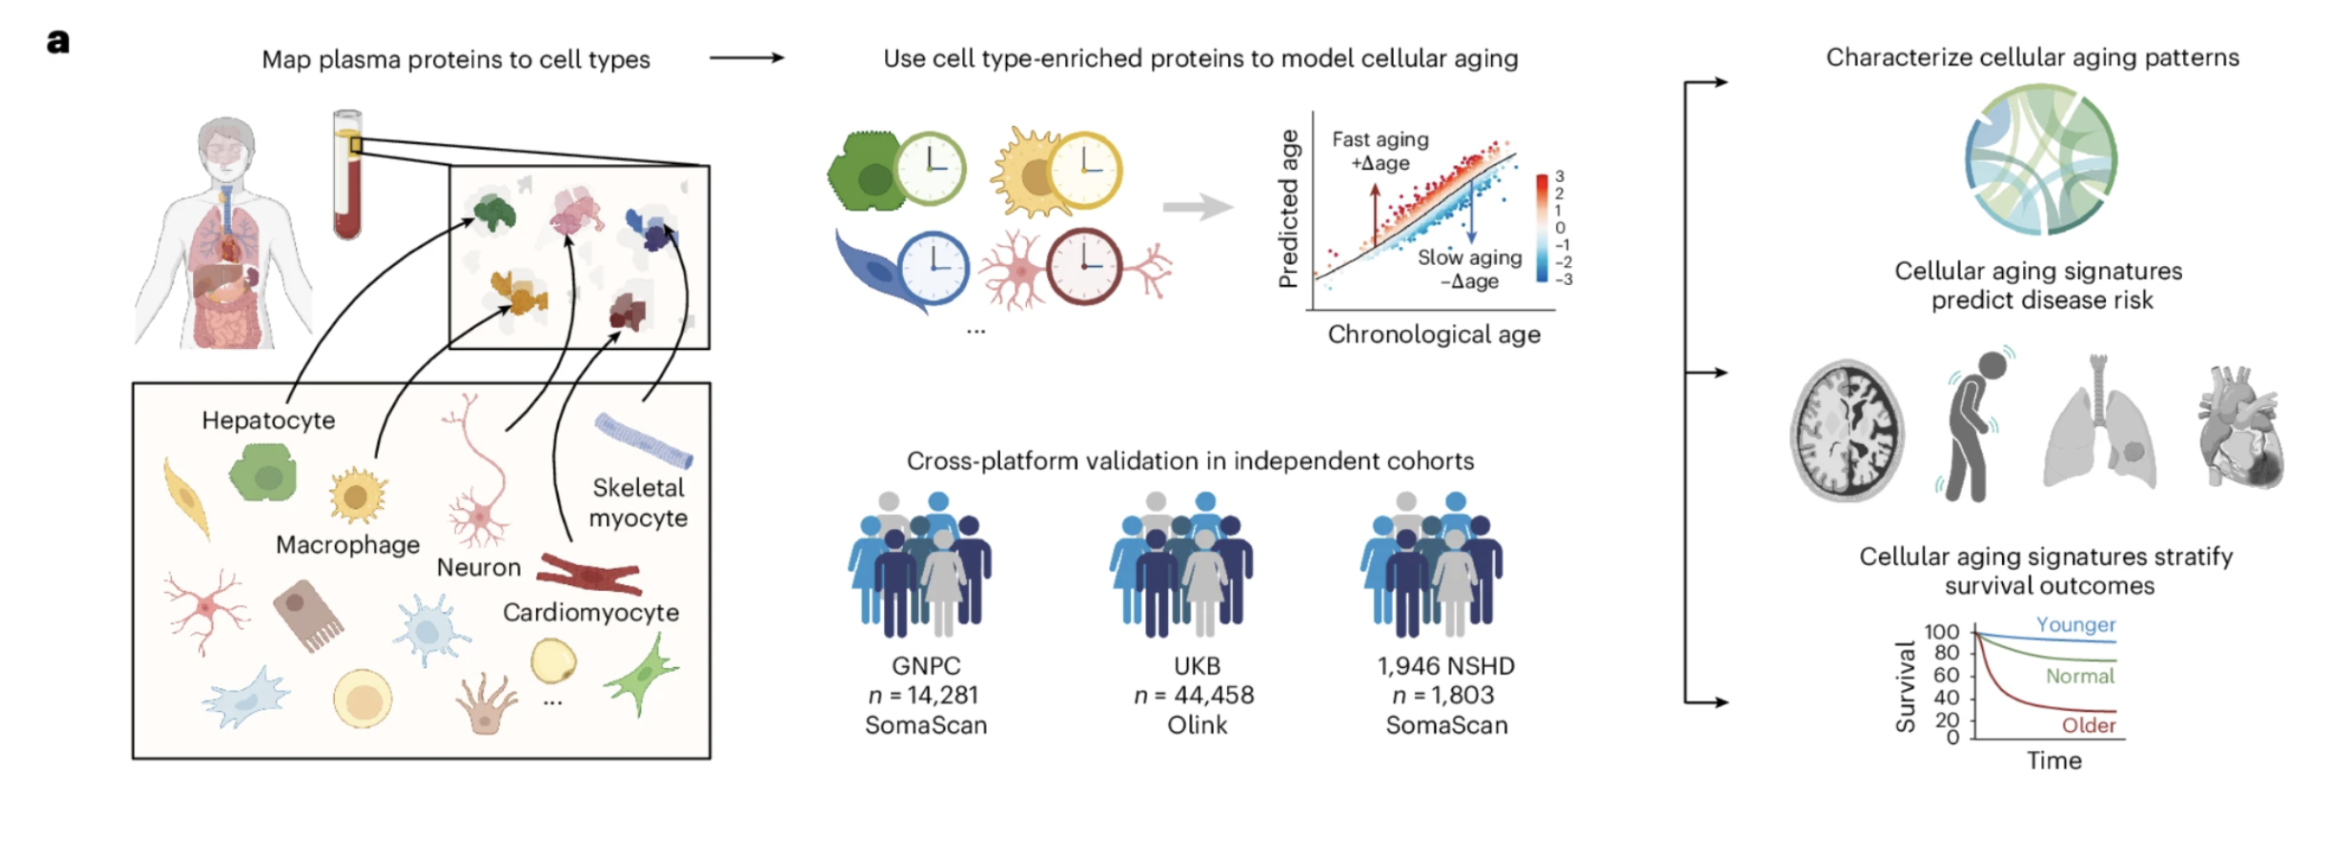
Figure 1: The study framework for modeling cellular aging with plasma proteomics. Plasma proteins were mapped to their putative cellular origins using the Human Protein Atlas, machine learning models were trained on healthy individuals to estimate cell type-specific biological age from those protein patterns, and the resulting age gap measurements were applied across three independent cohorts totaling more than 60,000 individuals. The framework was validated across two different proteomics platforms and three independent cohorts, establishing the robustness of the biological signals being measured across different technologies and populations.
The Logic of Liquid Biopsy Proteomics
The first feature is that cells communicate through proteins. Every cell type in the body secretes proteins into the bloodstream as part of its normal biological activity, and the specific proteins any cell type produces and releases reflect both its identity and its biological state. A cell under stress produces different proteins than a healthy cell. A cell aging rapidly produces a different protein signature than one aging slowly. These proteins circulate in the plasma, where they can be detected and measured from a standard blood draw.
The second feature is that different cell types produce different proteins. Not all of the thousands of proteins circulating in plasma are produced equally by all cell types. Many proteins are specifically or predominantly enriched in particular cell populations, reflecting the distinct gene expression programs that define cellular identity. A protein predominantly secreted by astrocytes carries information about the biological state of astrocytes. A protein enriched in skeletal myocytes reflects the metabolic and functional state of that cell population. If you can identify which proteins are specifically enriched in which cell types, and if you can measure enough of them simultaneously, the pattern of protein levels in plasma can be decoded to reveal the biological state of specific cellular populations without ever touching those cells directly.
This is the logic of liquid biopsy proteomics applied to cellular aging, and it is what makes the study's scale and non-invasiveness possible.
Building the Cellular Aging Models
The team began by leveraging the Human Protein Atlas, a comprehensive database that characterizes the expression patterns of proteins across human cell types using single-cell transcriptomic data. Using this resource, they classified proteins as cell type-specific if they were expressed at least twofold higher in one cell type compared to any other, identifying 1,202 cell type-specific proteins in the SomaScan platform and 708 in the Olink platform out of thousands measured.
With these cell type-specific protein panels identified, the team built machine learning models for each cell type. The models were trained on plasma protein data from healthy individuals, learning the relationship between the pattern of cell type-specific protein levels in plasma and chronological age. Once trained, these models could take a new individual's plasma protein measurements and estimate the biological age of each cell type independently, asking not how old this person's whole body appears to be, but how old their astrocytes appear to be, how old their skeletal myocytes appear to be, how old their respiratory epithelial cells appear to be, each assessed separately and simultaneously from the same blood sample.
More than 60 cell type models were built. After quality assessment filtering for predictive performance and reliability, 43 models using the SomaScan platform and 48 using the Olink platform were retained for downstream analysis. The models were validated across three independent cohorts, using two different proteomics platforms, in datasets totaling 60,542 individuals spanning multiple countries and study designs. The agreement across platforms and cohorts, different technologies measuring different protein sets in different populations, is one of the most important features of the study's architecture. Findings that replicate across independent methods and populations are considerably more robust than those that do not.
For each individual and each cell type, the team calculated what they call an age gap: the difference between that individual's cell type-specific biological age as estimated by the model and the biological age that an average person of their chronological age would be expected to have. A positive age gap means the cell type is aging faster than expected for someone of that chronological age. A negative gap means it is aging more slowly, reflecting what the study calls biological youth in that cell population.
These age gaps were standardized across cell types to allow comparison, since different cell types have different natural variability in their aging rates. Individuals were classified as extreme agers in a given cell type if their age gap exceeded two standard deviations above the mean, and as youthful agers if their gap fell below two standard deviations below the mean. These categorical classifications, extreme aging and youthful aging for each cell type, are the primary tool through which the study examines associations between cellular aging and disease.
The Scale That Makes the Findings Credible
It is worth pausing to appreciate the scale of the dataset this study assembled. The GNPC cohort contributed 14,281 individuals measured with SomaScan proteomics. The UK Biobank contributed 44,458 individuals measured with Olink proteomics. The 1946 National Survey of Health and Development contributed 1,803 individuals with longitudinal follow-up spanning 15 years and three measurement timepoints. Together these cohorts provide the statistical power to detect associations between cellular aging and disease incidence that would be invisible in smaller studies, and the independent replication across cohorts and platforms provides the confidence that the associations being reported are genuine biological signals rather than artifacts of any single dataset or technology.
This scale is not incidental to the findings. The hazard ratios for disease prediction that emerge from the study, including the 12.74-fold higher ALS risk associated with extreme skeletal myocyte aging and the 12.59-fold higher Alzheimer's risk associated with extreme astrocyte aging, are only interpretable in the context of follow-up data from tens of thousands of individuals tracked over 15 years. Smaller studies could not have produced findings of this statistical clarity or clinical magnitude.
What Normal Aging Looks Like Across Cell Types: The Population Picture
Before examining what cellular aging predicts about disease, the study establishes something more fundamental: what the landscape of cellular aging actually looks like across a healthy population. Understanding this baseline picture is essential for interpreting the disease associations that follow, because the significance of any individual's cellular aging profile depends on how it compares to the distribution of profiles across people of comparable age.
How Common Is Accelerated Cellular Aging
In healthy individuals across the study cohorts, the distribution of cellular aging patterns was striking in its heterogeneity. Roughly a third of healthy individuals showed no extreme cellular age gaps in any cell type. About a quarter showed accelerated aging in a single cell type. A smaller but clinically important minority, between one and three percent depending on the cohort, showed accelerated aging across ten or more cell types simultaneously. At the level of individual cell types, between roughly one and four percent of the population showed extreme acceleration in any given cell type, with a similar proportion showing extreme biological youth.
These numbers have an important practical implication. Accelerated cellular aging in specific cell populations is common enough to be clinically meaningful at a population level but specific enough that identifying who has it, and in which cell types, provides genuinely individualized information. The question of which one in four individuals showing accelerated aging in a single cell type is aging in their astrocytes versus their respiratory epithelium versus their skeletal myocytes is exactly the kind of question that cell type-specific biological age assessment is designed to answer.
When Different Cell Types Tend to Age
The timing of cellular age acceleration varied systematically across cell types in ways that are biologically interpretable. Neuronal and glial cell types including Schwann cells, inhibitory neurons, and excitatory neurons showed elevated rates of extreme aging predominantly in individuals over 85, consistent with the known concentration of neurodegenerative pathology in the most advanced decades of life. At the other end of the spectrum, intestinal goblet cells and ciliated cells showed accelerated aging more frequently in individuals under 60, emerging as early-aging populations whose deterioration may be contributing to midlife shifts in gut barrier integrity, microbiome composition, and systemic immune activation that precede the more visible pathology of later decades.
This age-dependent pattern of cellular extreme aging is one of the study's more conceptually interesting findings. If specific cell populations tend to show accelerated aging at specific life stages, those patterns may reflect distinct disease vulnerability windows in which interventions targeting those cell types would be most effective. Early accelerated aging in gut epithelial cells during midlife, for example, might represent an intervention window for preserving gut barrier integrity before the downstream inflammatory consequences of that deterioration have compounded into systemic pathology. Late accelerated aging in neuronal and glial populations might represent the biological correlate of the period immediately preceding clinical neurodegeneration, when the cellular damage has reached a threshold that composite biomarkers have not yet flagged.
One of the more unexpected findings in the population analysis was that cellular aging does not proceed entirely independently across cell types. Examining the patterns of co-occurring age gaps across healthy individuals in the GNPC cohort, the study found that cellular aging tends to proceed in a coordinated fashion across small groups of related cell types. Excitatory neurons, myelinating cells, and endothelial cells showed particularly pronounced coordination in their aging patterns, suggesting shared or synchronized molecular pathways driving their simultaneous acceleration.
Several cell populations emerged as aging hubs, showing correlations with multiple other cell types simultaneously. Excitatory neurons, Schwann cells, NK cells, macrophages, skeletal myocytes, and fibroblasts all appeared as nodes in this network with connections to multiple other aging cell populations. Epithelial cell types, by contrast, showed more isolated aging patterns with weaker correlations to other cell types, suggesting that epithelial aging is driven more by local tissue-specific stressors than by the systemic aging processes that coordinate deterioration across the more networked cell populations.
The existence of these aging hubs is practically important. An individual whose skeletal myocytes show extreme aging may be at elevated risk not only for the diseases directly linked to skeletal muscle deterioration but for the other cell type aging patterns that skeletal myocyte aging tends to co-occur with. Understanding the network structure of cellular aging, which cell types age together and which age independently, will be important for designing the next generation of biological age monitoring systems that can extract maximum clinical information from a given proteomics measurement.
Cellular Aging States Are Stable Over Time
Perhaps the most practically significant finding in the population characterization section is the temporal stability of extreme cellular aging states. Using the world's longest continuously followed birth cohort, the 1946 National Survey of Health and Development, the study tracked 364 individuals across three measurement timepoints over ten years and examined whether individuals classified as extreme agers in specific cell types at baseline remained in that category over the follow-up period.
The answer was yes, substantially. Fifty-five percent of individuals classified as extreme macrophage agers at baseline retained that status through the ten-year follow-up. Eighty-one percent of extreme alveolar type 2 cell agers retained their status. Youthful aging states showed similar stability profiles, with specific cell types showing characteristic patterns of state maintenance across the follow-up period.
This stability has two important implications. The first is methodological: cellular aging classifications derived from a single blood draw appear to reflect relatively stable biological states rather than transient fluctuations, which means they carry meaningful longitudinal information beyond the moment of measurement. A single cellular aging assessment provides genuine prognostic signal that persists over years.
The second implication is clinical and in some respects more sobering. If extreme cellular aging states tend to persist rather than resolve spontaneously, the window of opportunity for intervention may be more constrained than a dynamic model of cellular aging would suggest. An individual who has entered a state of extreme astrocyte aging is more likely to remain in that state than to return to normal aging over the following decade without intervention. This puts a premium on identifying cellular aging acceleration early and acting on it decisively, rather than assuming that biological trajectories will correct themselves over time.
Together, these population-level findings establish the baseline from which the study's disease association analyses proceed. Cellular aging is heterogeneous, partly coordinated, partly independent, driven by a combination of lifestyle and genetic factors, and once established, tends to persist. Against this backdrop, the associations between specific cellular aging patterns and specific diseases that the study goes on to demonstrate take on their full significance.
Lifestyle and Genetics Shape the Cellular Aging Map
Biological age science has always carried an implicit promise: if aging can be measured, it can be modified. The composite biological age models that preceded this study demonstrated that lifestyle factors influence overall biological age trajectories, but they could not specify which cellular populations those lifestyle effects were acting through. The cell type-specific framework this study introduces allows that question to be answered with considerably more precision, and the answers it produces are both reassuring in their consistency with existing evidence and genuinely new in their cellular specificity.
What Lifestyle Does to the Cellular Aging Map
In the UK Biobank cohort, the study compared the cellular aging profiles of two groups selected to represent opposite ends of the lifestyle spectrum. The healthy lifestyle group was defined stringently: never smoking, no regular alcohol consumption, at least five days per week of ten or more minutes of moderate or vigorous physical activity, BMI below 25, waist circumference within healthy ranges, and at least seven hours of sleep nightly. The unhealthy lifestyle group consisted of individuals with concurrent smoking and obesity, two of the most powerful modifiable drivers of biological aging that population research has identified.
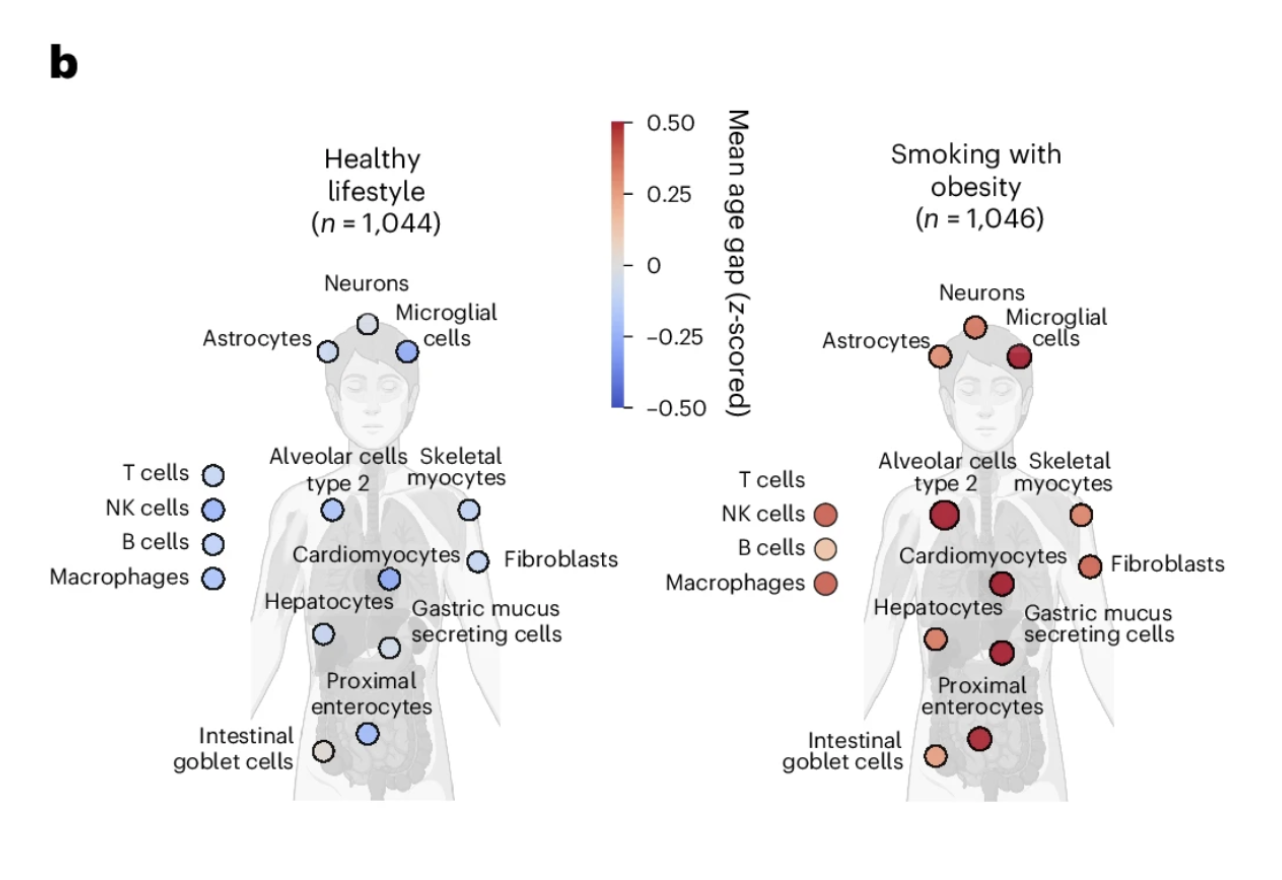
Figure 2b: Lifestyle shapes the cellular aging map. Individuals with a healthy lifestyle showed broadly younger cellular profiles across the full cell type panel compared to those with concurrent smoking and obesity. The contrast is visible across virtually every cell type, illustrating that healthspan-promoting behaviors preserve biological youth simultaneously across multiple cellular systems rather than acting on any single one.
The contrast in cellular aging profiles between these groups was visible across the full breadth of the 40-plus cell type panel. Individuals with concurrent smoking and obesity showed widespread acceleration of biological age across multiple cell types simultaneously, with few cell populations spared from the effects of this combination of chronic stressors. Individuals with the healthy lifestyle profile showed broadly younger cellular ages across the panel, with the pattern of youthfulness distributed across cell types in ways that suggest the lifestyle benefits are not confined to any single biological system but reflect a generally more favorable cellular maintenance environment across the body.
This finding does not tell us something new about whether lifestyle matters for biological aging. It does tell us something new about how lifestyle affects the cellular aging map: broadly, simultaneously, and in a pattern consistent with the idea that the lifestyle factors that extend healthspan are doing so partly by preserving the biological youth of specific cell populations whose deterioration drives the diseases of aging. The cell type-specific resolution makes visible what composite scores could only imply.
The Smoking Signal in Respiratory Epithelium
One of the most biologically coherent lifestyle findings is the relationship between smoking and respiratory epithelial cell aging. The study found that extreme aging in alveolar type 2 cells and the broader respiratory epithelial lineage was substantially more common in smokers than non-smokers, and that smokers with extreme respiratory cell aging showed 58 percent higher lung cancer risk compared to smoking alone. This cell type specificity is mechanistically meaningful: alveolar type 2 cells are the stem cells of the lung's gas exchange surface and the established cell of origin for lung adenocarcinoma, the most common form of lung cancer. Their accelerated aging in response to cigarette smoke exposure represents a biologically intelligible link between the carcinogen exposure and the malignant transformation that follows, and one that is now detectable from plasma proteomics before the clinical disease has emerged.
The practical implication is a more precise form of lung cancer risk stratification than smoking history alone provides. Two individuals with identical smoking histories may have dramatically different respiratory epithelial aging profiles, and those profiles appear to meaningfully stratify their lung cancer risk beyond what pack-years alone predicts. This is exactly the kind of individualized risk information that early detection programs need to prioritize surveillance resources effectively.
The APOE Paradox: Cellular Antagonistic Pleiotropy
The genetic findings in this study are among its most intellectually striking, and they require careful explanation because they reveal something about the biology of the APOE gene variants that composite biological age measures could not have shown.
APOE, the apolipoprotein E gene, is the strongest known genetic risk factor for late-onset Alzheimer's disease. The APOE4 variant increases Alzheimer's risk substantially relative to the more common APOE3 variant, while the APOE2 variant is protective. The standard clinical framing of APOE genotype is as a risk modifier for Alzheimer's disease specifically, mediated through its effects on amyloid clearance and neuroinflammatory signaling in the brain.
What this study reveals is that APOE genotype does not simply modify overall Alzheimer's risk. It shapes the cellular aging map in a specific and internally paradoxical way. APOE4 carriers showed older astrocytes compared to APOE3 carriers, consistent with the known role of APOE4 in accelerating the neuroinflammatory and metabolic dysregulation that astrocyte aging reflects. But APOE4 carriers simultaneously showed younger macrophages, the primary immune surveillance cells of the circulation. APOE2 carriers showed the exact inverse: younger astrocytes but older macrophages.
This antagonistic relationship between brain cell aging and immune cell aging across APOE genotypes is a cellular-resolution demonstration of what evolutionary biologists call antagonistic pleiotropy, the phenomenon in which a single gene variant produces beneficial effects in one biological context and harmful effects in another. The evolutionary hypothesis that makes sense of the APOE4 pattern is that the same biological properties that accelerate astrocyte aging and increase Alzheimer's risk in modern extended lifespans may have enhanced immune vigilance and pathogen resistance in ancestral environments where infectious disease was the primary mortality risk. APOE4 enhanced immune function and reduced infectious mortality at the cost of accelerated brain aging that only becomes clinically relevant when individuals survive long enough for that aging to produce neurodegeneration.
This cellular-resolution view of the APOE4 biology has a practical implication that goes beyond academic interest. It suggests that the question of why some APOE4 carriers develop Alzheimer's disease while others do not may partly be answered by the degree to which their astrocytes have entered a state of accelerated aging. APOE4 sets a biological predisposition. The astrocyte aging trajectory that follows from that predisposition, which appears to be modifiable by lifestyle and potentially by intervention, determines whether that predisposition translates into clinical disease. The next section addresses that interaction directly.
What the Lifestyle and Genetic Findings Mean Together
The combination of the lifestyle and genetic findings in this study points toward a clinical framework for thinking about cellular aging that is more sophisticated than either alone provides. Genetic variants like APOE4 shape which specific cell populations are most vulnerable to accelerated aging. Lifestyle factors influence the overall cellular aging environment across the full panel of cell types. The interaction between genetic vulnerability and lifestyle exposure, visible at cellular resolution in this dataset in a way it has not been visible before, is where the most actionable clinical information lies.
For an individual who carries APOE4 and wants to reduce their Alzheimer's risk, the study suggests that the relevant target is not just overall biological age but specifically astrocyte aging, and that the lifestyle behaviors most likely to preserve astrocyte youth, reducing neuroinflammation through exercise, sleep, metabolic health, and stress management, are the ones most directly relevant to their specific genetic vulnerability. The cellular aging map does not just tell you how fast you are aging. It tells you where the most consequential aging is happening, which makes it possible to direct preventive efforts toward the biological systems where they are most needed.
The Alzheimer's Finding: Astrocyte Aging as a Predictor Comparable to APOE4
Of all the disease associations in this study, the Alzheimer's findings are the most immediately significant for a longevity medicine audience. The numbers are striking enough to invite skepticism, which is itself a reason to examine them closely and understand precisely what they do and do not establish.
What Astrocytes Are and Why Their Aging Matters
Astrocytes are the most abundant non-neuronal cells in the brain, performing roles that extend well beyond structural support. They maintain the blood-brain barrier, provide metabolic support to neurons, regulate synaptic transmission, coordinate neuroinflammatory responses, and, through the glymphatic system that operates primarily during sleep, help clear the metabolic waste products, including amyloid-beta, that accumulate during waking activity.
When astrocytes age, all of these functions are progressively compromised. Aged astrocytes are less effective at maintaining the blood-brain barrier, less metabolically supportive to surrounding neurons, more pro-inflammatory, and less capable of clearing amyloid-beta and tau. The biology of astrocyte aging is, in many respects, the biology of the Alzheimer's disease environment. Against that backdrop, the magnitude of what this study found is biologically coherent even if the numbers initially seem remarkable.
The Magnitude of the Association
Individuals with extreme astrocyte aging showed a 12.59-fold increased risk of incident Alzheimer's disease compared to those with youthful astrocyte aging over 15 years of follow-up. The hazard ratio for extreme astrocyte aging was comparable to APOE4 carrier status, exceeding both the Alzheimer's polygenic risk score and chronological age as predictors. For women specifically, the association was stronger, with extreme astrocyte aging conferring a 6.84-fold hazard ratio compared to 3.54 in men. The combination of APOE4 and extreme astrocyte aging produced a 14.23-fold higher hazard ratio in women and 11.58-fold overall, pointing toward astrocyte aging as a meaningful part of the biological explanation for the higher prevalence of Alzheimer's disease in women.
The APOE4 Interaction
Among APOE4 homozygotes, those with extreme astrocyte aging showed 38.3 percent cumulative incidence of Alzheimer's over 15 years compared to 12.6 percent for those with normal astrocyte aging, a threefold difference within the same high-risk genetic group. This illustrates something fundamental about the relationship between genetic risk and biological aging: APOE4 sets a predisposition by accelerating astrocyte aging on average, but the degree to which any individual's astrocytes have entered a state of extreme biological aging determines how much of that predisposition has translated into active deterioration. Two APOE4 homozygotes with identical genetic risk can have dramatically different Alzheimer's trajectories depending on their astrocyte aging trajectory, and that distinction is now detectable from plasma proteomics.
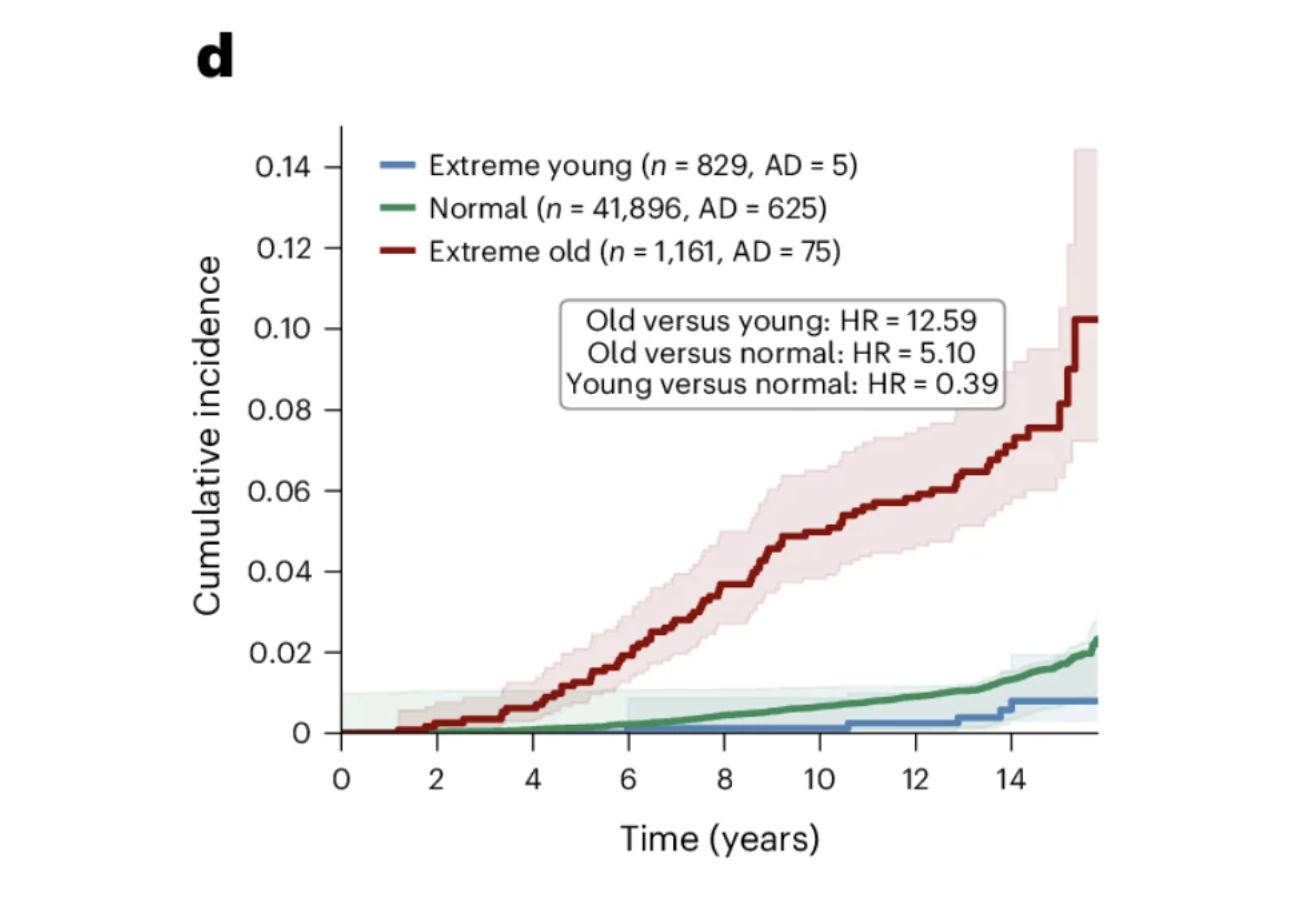
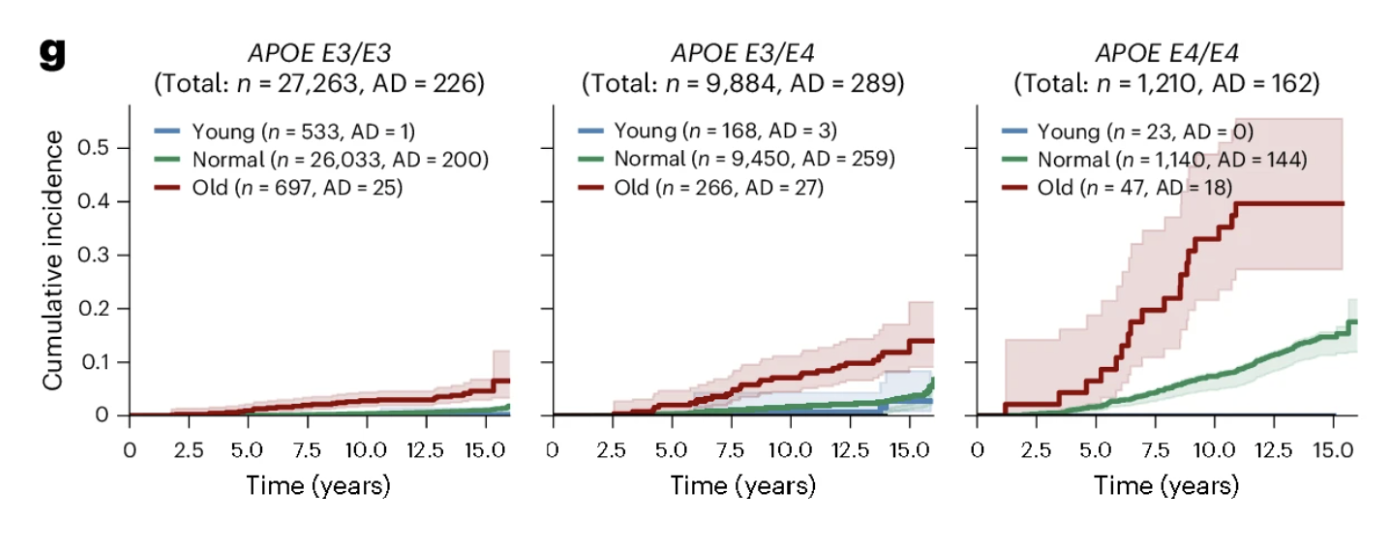
Figures 3d and 3g: Astrocyte aging stratifies Alzheimer's risk independently of and synergistically with APOE genotype. Extreme astrocyte agers show substantially higher cumulative Alzheimer's incidence over 15 years than normal agers, while youthful astrocytes confer meaningful protection. This risk gradient persists across every APOE genotype group, with extreme astrocyte aging consistently identifying individuals at elevated risk regardless of genetic background and youthful astrocytes attenuating risk even in APOE4 homozygotes.
The Most Important Finding
Among the 23 APOE4 homozygotes with youthful astrocytes in the UK Biobank cohort, none developed Alzheimer's disease during the 15-year follow-up period. Twenty-three is a small number and should not be overinterpreted. But the direction is striking. Youthful astrocytes reduced Alzheimer's risk by more than 60 percent across all APOE genotype groups, and in the highest-risk genetic group, they appeared to substantially attenuate the expression of that vulnerability. What determines whether an APOE4 carrier's astrocytes remain biologically young is now one of the most important questions in Alzheimer's prevention research, and this study provides both the measurement framework and the clinical motivation to pursue it.
For anyone thinking seriously about Alzheimer's prevention, the practical implication is a shift in how risk should be understood. APOE genotype provides important baseline information about genetic predisposition. Astrocyte biological age tells you how much of that predisposition has been expressed in this individual's biology. The combination of the two is the framework that the study demonstrates, and that Alzheimer's prevention medicine is beginning to be able to act on.
The ALS Finding: Skeletal Myocyte Aging as the Strongest Association in the Dataset
If the Alzheimer's findings are the most immediately resonant for a general longevity audience, the ALS findings are the most statistically striking in the entire paper. The association between skeletal myocyte aging and ALS is the strongest of any disease-cell type pair examined, and it carries implications that extend beyond ALS biology to how we think about the relationship between peripheral tissue aging and neurological disease more broadly.
What the Numbers Show
In the GNPC cohort, 93 percent of individuals classified as extreme skeletal myocyte agers had an ALS diagnosis. Within the disease-enriched GNPC cohort, extreme skeletal myocyte aging was almost exclusively found in ALS patients, making it one of the most disease-specific biological signatures in the entire analysis. In the UK Biobank cohort, closer to a general population sample, individuals with extreme skeletal myocyte aging showed a 12.74-fold higher risk of incident ALS over 15 years of follow-up. Cardiomyocyte aging was also significantly associated with ALS, with extreme cardiomyocyte agers showing a 6.59-fold higher hazard ratio, consistent with the cardiac abnormalities increasingly documented in ALS patients and potentially reflecting shared molecular pathways affecting both muscle tissue types simultaneously.
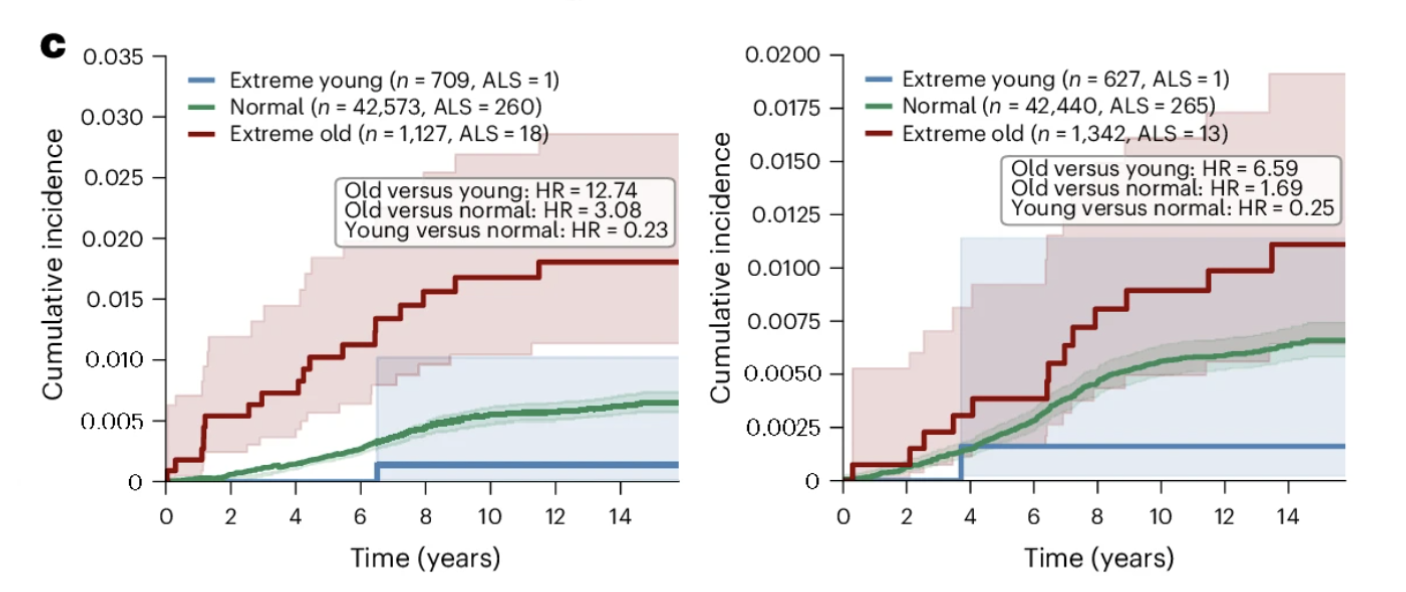
Figure 3c: Skeletal myocyte aging predicts incident ALS over 15 years of follow-up. Individuals with extreme skeletal myocyte aging show substantially higher cumulative ALS incidence than normal and youthful agers, representing a 12.74-fold difference in hazard ratio, the strongest disease prediction finding in the dataset. Cardiomyocyte aging shows a similar pattern, consistent with shared molecular pathways affecting both muscle tissue types. The relationship persisted even for cases diagnosed more than three years after the baseline blood draw, suggesting the skeletal myocyte aging signature captures pathological processes beginning years before clinical onset.
Why This Appears Before Symptoms
The most clinically consequential aspect of the ALS finding is its temporal relationship to clinical diagnosis. The association between extreme skeletal myocyte aging and future ALS diagnosis persisted even when considering only cases diagnosed more than three years after the blood draw. This multi-year gap suggests that the biological deterioration of muscle tissue the proteomics signature captures, is not simply an early manifestation of established disease. It may reflect pathological processes beginning in muscle years before motor neuron degeneration has reached a detectable threshold.
This connects to a genuinely contested question in ALS biology: is the disease purely a motor neuron disease, with peripheral muscle wasting as a downstream consequence, or does pathology in peripheral tissues, including muscle, contribute to disease initiation alongside the motor neuron degeneration? The standard framing has been the former. But a growing body of evidence, including these findings, is consistent with a more complex picture in which peripheral muscle tissue is an active participant in the disease process rather than simply a passive victim of it.
ALS currently has no disease-modifying treatment and is typically diagnosed after significant motor neuron loss has already occurred. An upstream biological signature detectable years before diagnosis represents exactly the kind of early warning that might enable intervention at a stage when the disease process might still be redirectable, a possibility the field has not previously had a clear path to realizing.
What the ALS Finding Means Beyond ALS
The ALS finding matters for the longevity field beyond any single disease. It demonstrates that cell type-specific biological age assessment can identify disease-relevant biological signatures years before clinical onset in conditions where early detection has previously been essentially impossible. The proof of concept that plasma proteomics can detect the cellular aging trajectory associated with ALS years before diagnosis changes what early detection for this disease might eventually look like.
More broadly, it illustrates the principle motivating the entire framework: diseases that appear to originate in one tissue may have detectable biological signatures in peripheral tissues years before primary pathology becomes clinically apparent, and a sufficiently high-resolution biological age assessment system may be capable of reading those signatures from a blood test. Which other diseases follow this pattern is one of the most important questions the study opens up.
Beyond Neurodegeneration: What Cellular Aging Predicts for Cancer and Chronic Disease
The neurodegenerative disease findings are the most dramatic in the paper, but the study's disease prediction framework extends considerably further. Examining incident cancer, cardiovascular disease, metabolic disease, and pulmonary disease over 15 years of follow-up in the UK Biobank cohort, the study demonstrates that cell type-specific aging signatures carry prognostic value across a broad range of conditions, with cell type specificity that is in each case biologically coherent rather than statistically incidental.
Lung Cancer: When Respiratory Cell Aging Amplifies Smoking Risk
For lung cancer, extreme aging in alveolar type 2 cells and the broader respiratory epithelial lineage emerged as the strongest predictors with hazard ratios of 8.39 and 8.47 respectively. Current smokers with extreme aging in both respiratory cell types showed a 58 percent higher hazard ratio than current smoking alone, while the prognostic value of respiratory cell aging remained significant after adjustment for age, sex, smoking status, and pack-years. The cellular aging signature provides independent information about biological vulnerability that smoking history alone cannot capture.
The cell type specificity is mechanistically meaningful. Alveolar type 2 cells are the stem cells of the lung's gas exchange surface and the established cell of origin for lung adenocarcinoma. Their accelerated aging reflects a compromised regenerative capacity that appears to create a permissive environment for malignant transformation when combined with carcinogen exposure. Two smokers with identical pack-year histories can have dramatically different lung cancer risk profiles depending on whether their alveolar type 2 cells are aging at an accelerated or normal rate.
Type 2 Diabetes: The Myeloid Aging Signal
For type 2 diabetes, extreme myeloid lineage aging demonstrated the strongest prognostic value with a hazard ratio of 3.88, remaining significant after adjustment for established metabolic risk factors. Among prediabetic individuals, those with extreme myeloid lineage aging showed substantially higher progression to type 2 diabetes over 15 years. Among normoglycemic individuals, myeloid lineage extreme aging identified a subset at elevated diabetes risk who would not have been flagged by standard metabolic risk assessment, adding immunological risk information to the metabolic picture that existing clinical tools do not provide.
Heart Failure, Stroke, and Lymphoma
For heart failure, extreme aging in muscle cells and fibroblasts was most prognostic with hazard ratios of 4.65 and 4.62 respectively, consistent with the established role of fibroblast-driven cardiac remodeling and cardiomyocyte deterioration in heart failure pathogenesis. For stroke, extreme aging in NEFL-C1QL2 projection neurons showed the strongest association at a hazard ratio of 3.03, followed by microglia at 2.84, adding a neuroinflammatory dimension to stroke risk stratification that conventional cerebrovascular risk tools do not capture.
The lymphoma findings deserve particular attention for the magnitude of the hazard ratios. Extreme granulocyte aging showed a hazard ratio of 10.09 for incident lymphoma, followed by T cells at 6.75 and B cells at 6.63. The co-occurrence of accelerated aging across multiple immune cell lineages in individuals who subsequently develop lymphoma raises the hypothesis that coordinated aging across the hematopoietic niche may facilitate early lymphomagenesis. The authors note these hazard ratios exceed those for lymphoid clonal hematopoiesis of indeterminate potential, a currently recognized lymphoma risk factor, suggesting the cellular aging signatures may provide independent and additive risk information.
The Pattern Across Disease Associations
Reading across these findings, a consistent pattern emerges. In every disease category examined, the cell types showing the strongest prognostic associations are those most directly implicated in that disease's established pathophysiology. Respiratory epithelial cells for lung cancer. Myeloid immune cells for type 2 diabetes. Cardiomyocytes and fibroblasts for heart failure. Projection neurons and microglia for stroke. B cells and granulocytes for lymphoma. The cell type specificity is not arbitrary. It reflects the underlying biology of each condition, which means the proteomics signatures are capturing real biological signal rather than statistical noise. The biological age of the cell types most relevant to a given disease predicts that disease's development years before clinical onset, across a range of conditions spanning neurodegeneration, cancer, cardiovascular disease, and metabolic dysfunction.
The Polycellular Aging Risk Score: From Cell Types to Survival Prediction
The disease-specific findings establish that individual cell type aging signatures predict specific conditions with striking precision. But aging rarely threatens health through a single cellular vulnerability. Most individuals who die prematurely from age-related causes are not undone by the failure of one cell type but by the cumulative deterioration of multiple biological systems. The study's final major contribution addresses this reality directly, asking whether the information contained across the full panel of cell type aging signatures can be integrated into a single score that predicts overall mortality risk more powerfully than any individual cell type measure alone.
The Dose-Response Relationship Between Cellular Aging Burden and Survival
The data revealed a dose-response relationship between the number of cell types showing extreme aging and survival, which is among the most visually compelling findings in the paper. Individuals with normal aging profiles maintained approximately 90 percent survival over 15 years. Those with extreme aging in one to five cell types showed approximately 85 percent survival. Six to ten extremely aged cell types corresponded to approximately 73 percent survival. Eleven to twenty corresponded to approximately 52 percent survival. And individuals with extreme aging across more than twenty cell types showed approximately 34 percent survival over the same period.
The difference between 90 percent and 34 percent survival derived entirely from a blood test measuring plasma protein levels, without clinical symptoms, imaging, or tissue biopsy, is the kind of finding that changes how biological age monitoring should be understood. The inverse relationship is equally important. Individuals with youthful immune lineage or neuron lineage cell types showed survival comparable to or better than normal agers regardless of their status in other cell types. Biological youth in specific cell populations appears to be an active resilience factor, not simply the absence of accelerated aging.
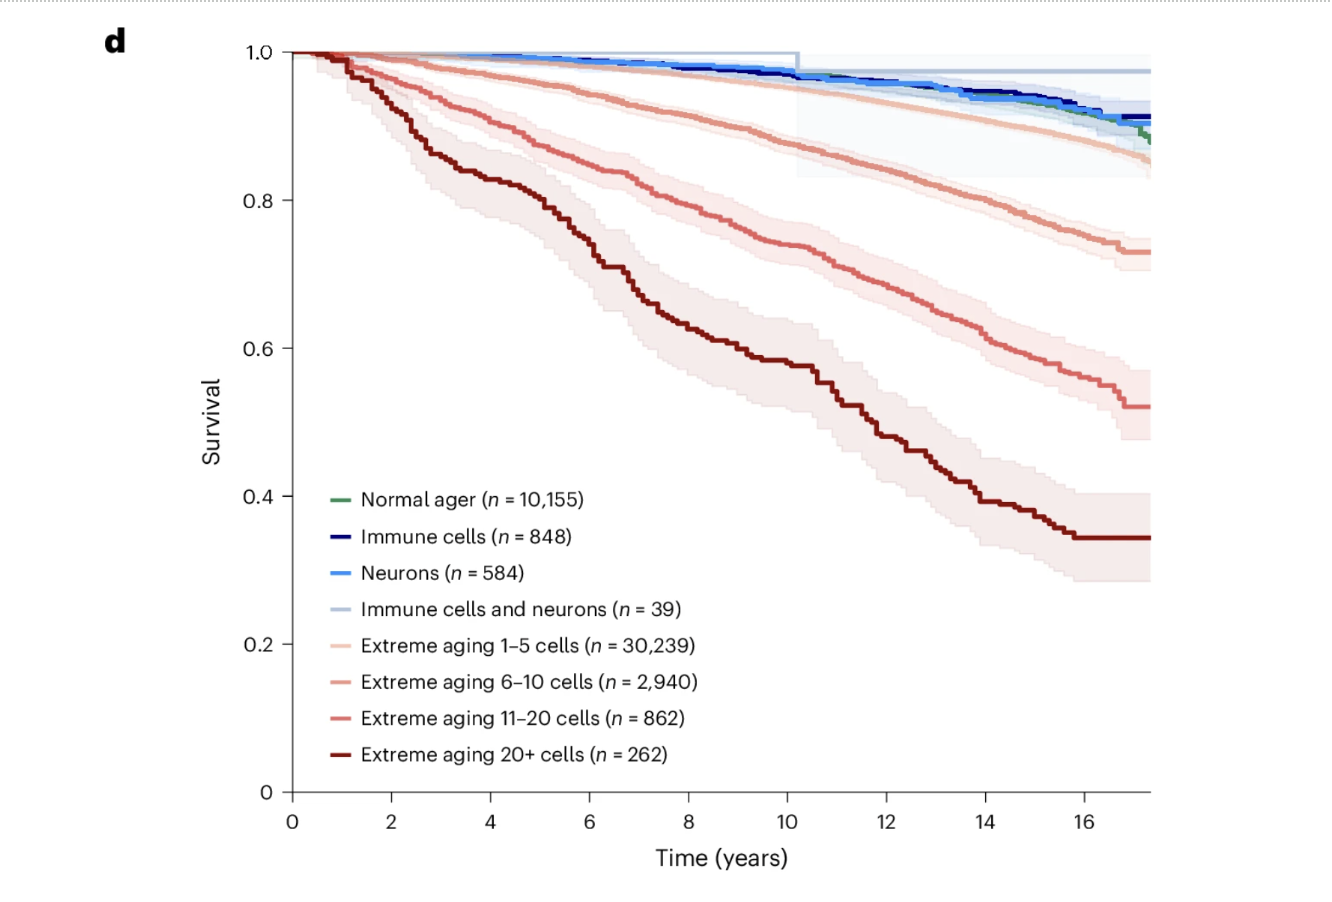
Figure 5d: Cumulative cellular aging burden predicts survival in a striking dose-response pattern. Fifteen-year survival declines progressively from approximately 90 percent in individuals with normal aging profiles to approximately 34 percent in those with extreme aging across more than 20 cell types. Individuals with youthful immune or neuron lineage cell types showed survival comparable to or better than normal agers regardless of their status in other cell types, suggesting that biological youth in specific protective cell populations confers active resilience rather than simply reflecting the absence of accelerated aging.
What the Score Includes and How It Performs
The polycellular aging risk score integrates the pattern of extreme aging across multiple cell types into a mortality-optimized composite. Skeletal myocyte aging contributed the largest coefficient, consistent with its emergence across the study as the individual cell type most strongly associated with all-cause mortality, with extreme muscle lineage aging carrying a hazard ratio of 4.38 for all-cause mortality. Neurons, fibroblasts, alveolar type 2 cells, and myeloid lineage cells all contributed meaningfully, reflecting the multi-system nature of aging and the importance of preserving biological youth across neurological, structural, pulmonary, and immune compartments simultaneously.
The score was trained in one UK Biobank subset using Olink proteomics, tested in a held-out UK Biobank subset, and validated in the NSHD cohort using SomaScan proteomics, a completely different technology measuring a different set of proteins in a different population. Across all three datasets, the score stratified participants into high, medium, and low mortality risk groups with highly significant results. This cross-platform replication demonstrates that the biological signal is robust enough to survive the transition between different measurement technologies in different populations, which is the kind of generalizability a clinical biomarker requires before it can be taken seriously as a practical tool.
What the PARS Adds to Existing Biological Age Models
The Bortz model and its predecessors estimate overall biological age from routine circulating biomarkers, producing a single number reflecting the aggregate biological state of the organism. The PARS uses a much larger protein panel to estimate not overall biological age but the specific cellular aging burden most predictive of mortality, integrating information across more than 40 cell types into a mortality-optimized composite. These are related but distinct measurements. An individual could have a relatively favorable overall biological age score while carrying a high PARS if their mortality-relevant cell types are aging particularly rapidly, or vice versa.
At Healthspan, the biological age framework we use through the Bortz model and organ-specific supplementary assessments represents the current state of accessible biological age monitoring. The PARS represents the direction this framework is heading: toward cell type-specific resolution, measured from plasma proteomics, optimized for mortality and disease prediction. The proteomics platforms that make the PARS possible are not yet part of routine clinical practice, but the framework the study establishes is the next generation of biological age medicine. Understanding it changes how we should think about what our current biological age scores are detecting and what the tools we will eventually have available will tell us about individual aging trajectories with cellular precision.
Limitations and What Comes Next
A study of this scale earns the right to be taken seriously, and taking it seriously requires engaging honestly with what it has not yet established alongside what it has.
The analysis is necessarily limited to cell types cataloged in the Human Protein Atlas with sufficient plasma protein representation. Specialized populations including rare immune cell subsets, specific neuronal subtypes, and tissue-resident cells with limited plasma protein contribution are either absent or captured only coarsely. The foundational assumption that cell type-specific proteins in plasma reflect the biological state of their assigned cell types is well-supported but not absolute. Under pathological conditions, normal cell type-specific expression patterns can be disrupted, potentially confounding the cellular aging signals with contributions from non-assigned sources. The consistency of associations across independent cohorts and platforms provides reassurance but does not fully resolve this concern.
The cohorts were predominantly older and Caucasian, limiting generalizability to younger individuals, non-European ancestries, and populations with different disease prevalences and environmental exposures. And critically, the study establishes that specific cellular aging patterns predict disease and mortality with striking precision. It does not establish whether interventions that modify those patterns alter disease trajectories in the ways the associations predict. This is the gap that matters most for clinical translation.
The research priorities follow directly from the findings. Validation in younger, more diverse populations would establish the generalizability clinical application requires. Investigation of the lifestyle, genetic, and pharmacological determinants of specific cellular aging trajectories, particularly for astrocytes, skeletal myocytes, and respiratory epithelial cells, would begin to answer the intervention question. Development of more accessible and standardized proteomics platforms would bring the framework closer to routine practice. And longitudinal intervention studies with cellular aging biomarkers as primary endpoints would establish whether modifying cellular aging trajectories produces the health benefits the observational associations predict.
The field has moved from composite biological age scores to organ-specific scores to cell type-specific scores within roughly a decade, with each increment in resolution revealing information the previous level could not capture. The framework this study establishes is the map. Filling it in with the validation, mechanistic understanding, and clinical infrastructure a genuine clinical tool requires is what comes next.
Conclusion: A New Resolution for Aging Biology
Biological age science has always been trying to answer the same fundamental question: what is actually happening inside this person's body, and how does it compare to what should be happening at their age? The composite biological age models that have anchored this field, PhenoAge, the Bortz model, and their successors, have been valuable precisely because they distill a complex biological reality into something measurable and actionable from a standard blood draw. They tell you something true and clinically useful about the overall trajectory of biological aging. What they cannot tell you is where in the body that aging is most concentrated, which specific cellular populations are driving the trajectory, and which biological systems are showing resilience that might be leveraged or vulnerability that demands attention.
This study answers those questions at a resolution that biological age science has not previously achieved. From a single blood test measuring thousands of plasma proteins, it is now possible to estimate the biological age of more than 40 distinct cell types simultaneously, identify which of those cell types are aging faster than expected and which are biologically younger than their chronological age would predict, and use those cell type-specific aging profiles to stratify disease risk and mortality over a 15-year horizon with a precision that exceeds what composite biological age scores, genetic risk factors, and conventional clinical biomarkers have previously provided.
The specific findings that make this framework clinically significant are not abstractions. Extreme astrocyte aging predicts Alzheimer's disease with a hazard ratio comparable to carrying two copies of the APOE4 gene variant, and youthful astrocytes reduce Alzheimer's risk by more than 60 percent even in genetically predisposed individuals. Extreme skeletal myocyte aging predicts ALS with a 12.74-fold higher hazard ratio, detectable years before clinical symptoms emerge. Extreme respiratory epithelial aging in smokers identifies a subgroup at 58 percent higher lung cancer risk than smoking alone. The number of cell types showing extreme aging predicts 15-year survival across a gradient from 90 percent survival with normal aging profiles to 34 percent survival with extreme aging across 20 or more cell types.
These numbers point toward something beyond better risk prediction. They point toward a framework for understanding individual biological vulnerability at a resolution that makes precision longevity medicine genuinely possible. An individual's cellular aging map reveals not just how fast they are aging overall but which specific biological systems are most urgently in need of intervention, which are showing resilience that protective factors are maintaining, and where the window of opportunity for changing the trajectory is widest before the damage becomes self-sustaining.
The technology that makes this possible is not yet part of routine clinical practice. The proteomics platforms required to measure thousands of plasma proteins simultaneously remain specialized, expensive, and not yet standardized for the clinical context in the way that routine laboratory panels are. The intervention studies needed to establish whether modifying specific cellular aging trajectories produces the health benefits the observational associations predict have not yet been conducted. The validation in younger, more diverse populations that clinical generalizability requires is ongoing.
But the direction is clear. At Healthspan, the biological age framework we use today, grounded in the Bortz model and organ-specific supplementary assessments derived from accessible circulating blood markers, represents the current state of what responsible clinical biological age monitoring looks like. This study represents what the next generation of that monitoring will look like: cell type-specific, plasma proteomics-based, optimized for disease prediction rather than simply age estimation, and capable of revealing the specific cellular vulnerabilities that determine where any individual's aging trajectory is heading and where intervention is most likely to change it.
The question that has always motivated biological age science, what is actually happening inside this person's body, now has an answer at a resolution that makes the question worth asking in an entirely new way. Not how old are you biologically. But which of your cells are aging fastest, which are staying young, and what does that tell us about the diseases you are most at risk for and the interventions most likely to help. That is the question this framework is beginning to answer, and it is one of the most important questions in medicine.
- Ding, D.Y., Bot, V.A., Chen, K.L. et al. Plasma proteomic signatures of cellular aging predict human disease. Nat Med 32, 2060–2072 (2026). https://doi.org/10.1038/s41591-026-04446-y
Related studies