BMI, Body Composition, and Longevity: Rethinking the Metrics of Health
BMI is simple, accessible, and has utilitarian benefits in assessing population health data. Limitations of BMI as a stand-alone marker does not serve individuals, athletes, diverse people groups, or people with normal weight obesity effectively.
The term obesity paradox is really based upon misclassification of true obesity based upon BMI and therefore should be adapted to “BMI-paradox.”
The American Medical Association adopted a new policy in 2023 supporting removal of BMI as a standard measure in medicine in large part because of heterogeneity across race/ethnic groups, sexes, genders, and age-span.
Select an alternative index or indices that work for you based upon the tools you have available.
Even if you do not have access to body composition measurements you can leverage key health indices to improve resolution in your health and longevity picture.
Waist circumference is a powerful measurement that is leveraged in a majority of BMI alternatives to better predict healthspan and mortality.
Measuring height, weight, and waist circumference enables you to capture your own health status and longevity using 7 out of 10 indices, not including BMI.
Routine check-in measurements could provide a conglomerate of metrics that would enable you to see changes for monitoring and tracking improvements in your own health status and mortality risk.
If you have access to a body weight scale that incorporates BIA (body fat estimate built into scale) then you could easily apply all 10 of these alternative indices to enhance your own healthspan or longevity analysis as you target specific indices or areas for improvement in your individual health.
Background
Quetelet’s index, the original name for BMI, was developed by Lambert Adolphe Jacques Quetelet. There had previously been ongoing discussions surrounding the classification of ideal body weight in humans. The Metropolitan Life Insurance tables for ideal body weight for men and women relied upon separate reference tables and provided body weight targets in one-inch height increments across three different frame sizes [1], or somatotypes [2].
Although Quetelet developed and published his index in 1835, it was not widely used until the 1970s, when Reubin Andres, Clinical Director of the National Institute on Aging, investigated actuarial data on roughly 4,200,000 life insurance policies along with mortality ratios. Andres concluded that Quetelet’s index was superior and less complicated than tables containing reference weights [1]. Of note, major advantages of Quetelet’s index, hereafter referred to as BMI, were that there was a U- or J-shaped curve associated with BMI values and, more importantly, the BMI range associated with minimal mortality was the same for men and women [3].
BMI, calculated as weight in kilograms divided by height in meters squared, has been used for decades in modern medicine and research. BMI is the international standard for the classification of health based on an individual’s height and weight [4]. Large-scale studies and meta-analyses have found strong associations between BMI and all-cause mortality; most have described a U-shaped association with minimum mortality in the healthy (20–25 kg/m^2) BMI range [1,5,6,7,8]. However, the nuances of this relationship become more complex upon closer examination.
How Does BMI Relate to Human Longevity?
BMI Association with All-cause and Cause-specific Mortality
In 2018, the largest study ever conducted on the association between BMI and mortality—evaluating over 3.6 million people in the United Kingdom—was published in The Lancet [5]. The research team concluded that BMI has a J-shaped relationship with all-cause mortality (Figure 1) and many specific causes of death [5].
According to study data, compared with individuals classified as healthy weight (BMI 18.5–24.9 kg/m²), life expectancy from age 40 was 3.5 years shorter in obese women (BMI ≥30.0 kg/m²) and 4.2 years shorter in obese men. Similarly, life expectancy was 4.5 years shorter in underweight women (BMI <18.5 kg/m²) and 4.3 years shorter in underweight men. The largest discrepancy in life expectancy, based on all-cause mortality data, was observed between those classified as having a healthy BMI and those with class III obesity (BMI >40 kg/m²), where life expectancy was 7.7 years shorter in women and 9.1 years shorter in men [5].
Associations between BMI and mortality were more robust at younger ages than at older ages (>70 years), where the variance in the data was greater. In accordance with previous research, an overweight BMI was associated with the lowest mortality risk in older individuals, but not in younger individuals [1, 5, 9, 10].
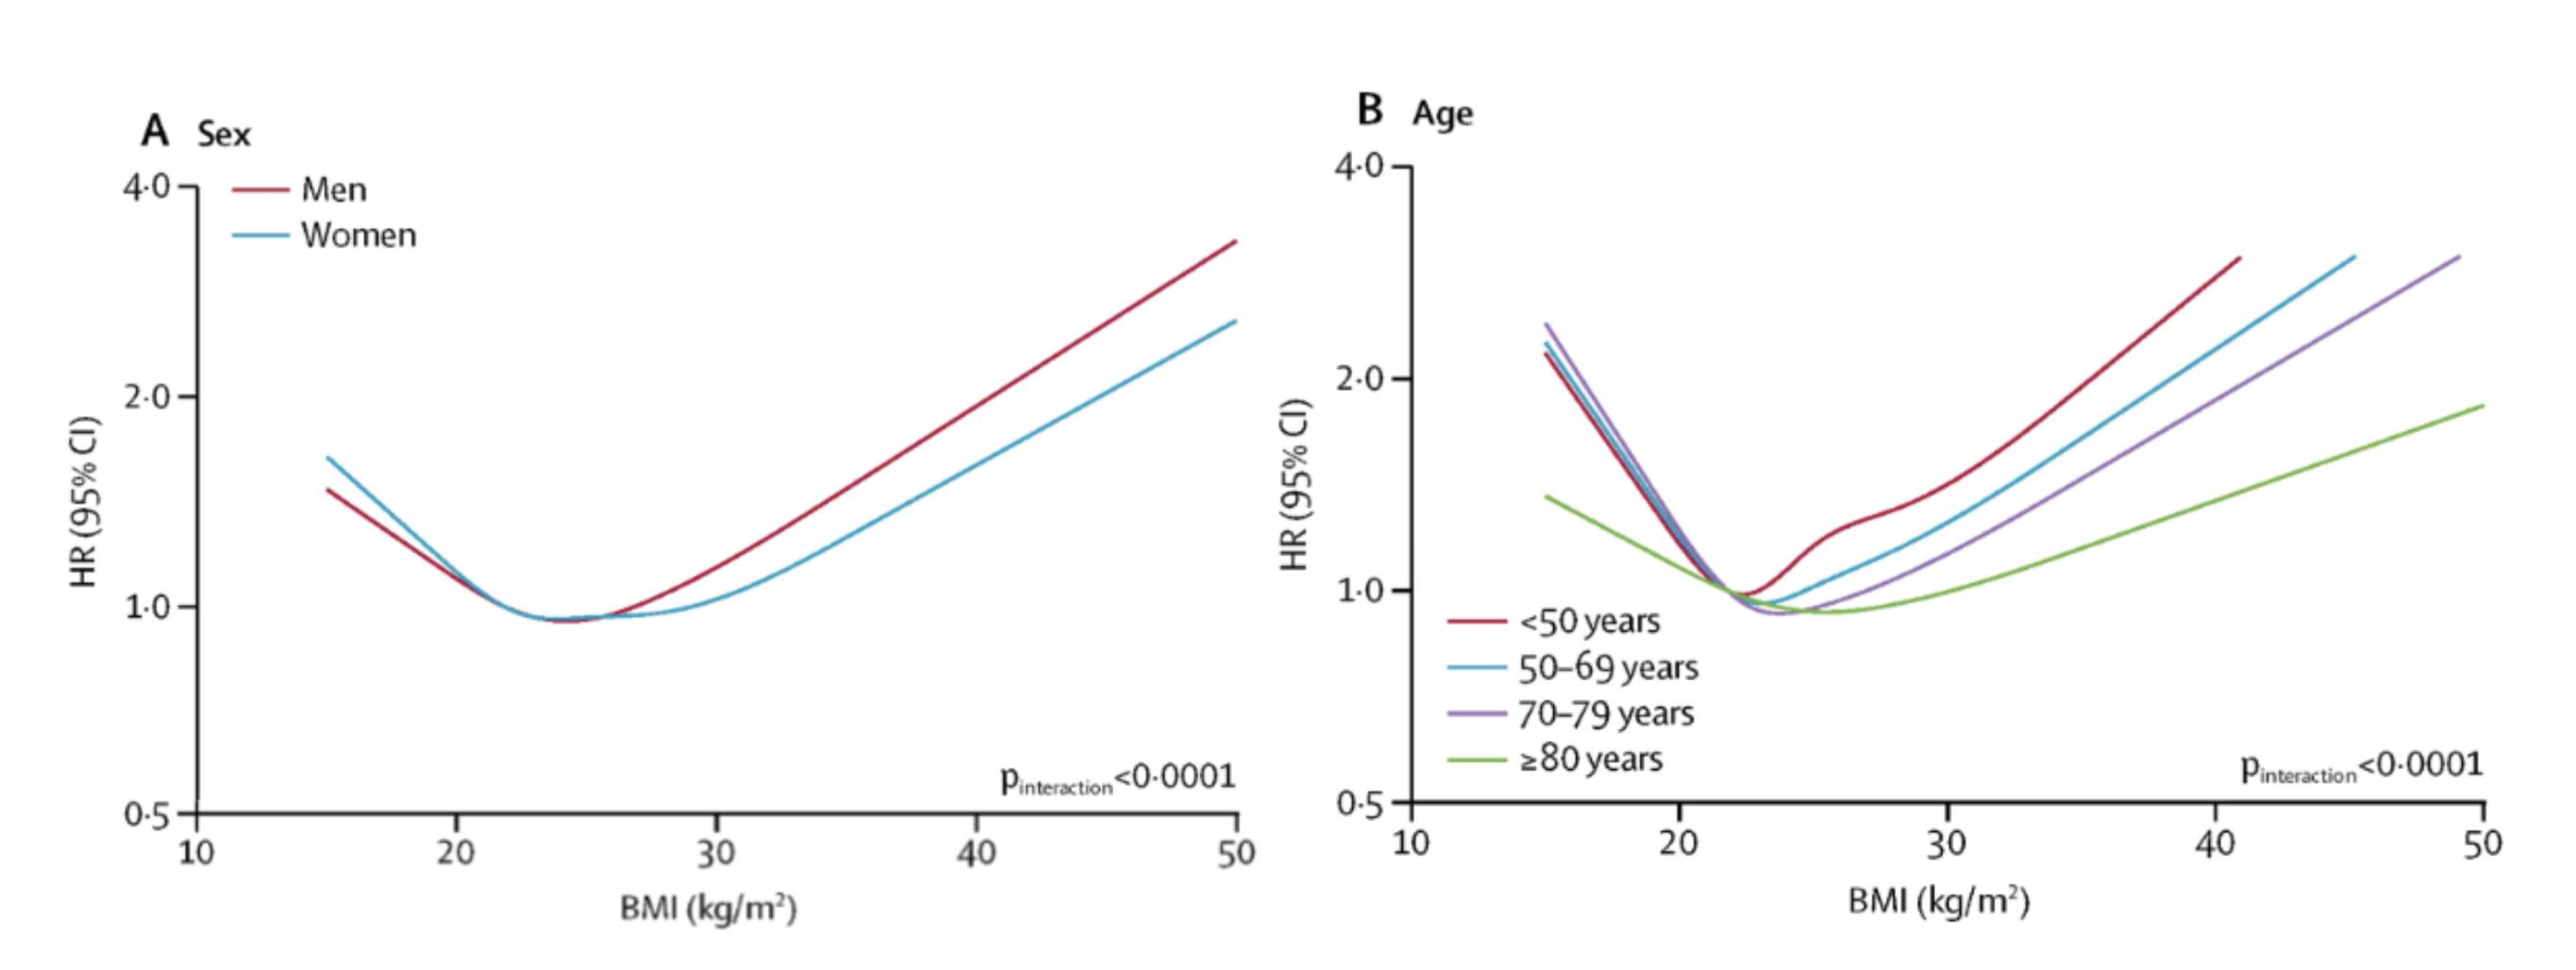
Figure 1. BMI and all-cause mortality. Reprinted from “Association of BMI with overall and cause-specific mortality: a population-based cohort study of 3·6 million adults in the UK,” by K. Bhaskaran, 2018, The Lancet Diabetes & Endocrinology, Volume 6 (Issue 12), 944 - 953.
Cause-specific mortality (Figure 2) is more nuanced, where certain conditions, diseases, or external causes—such as accidents—present unique risks in relation to BMI. Surprisingly, mortality from injuries and external causes shows an inverse relationship, where lower BMI was associated with a 28% higher risk of mortality (HR, 1.28) [5]. There was minimal change, or a slight 11% decline in mortality (HR, 0.89), at higher BMI (>30 kg/m²), indicating there may be a protective effect of higher BMI in reducing mortality from events such as accidents, falls, or other physical injuries [5].
A J-shaped association exists between BMI and mortality attributed to communicable as well as non-communicable diseases where there was a 20-30% increase for every 5 kg/m2 above a BMI of 25 kg/m2 [11]. There were consistencies among several research datasets indicating that in select cancers [11,12,13], cardiovascular diseases [13,14], and heart failure [15], mortality was disproportionately higher for individuals with BMI >30 kg/m2. This is the majority trend; however, there are cause-specific examples where higher BMI may not be associated with greater mortality. For example, neurological disease, aortic aneurysm, prostate cancer, and brain or lung cancer are unaffected—or even positively impacted—by BMI >30 kg/m² [5].
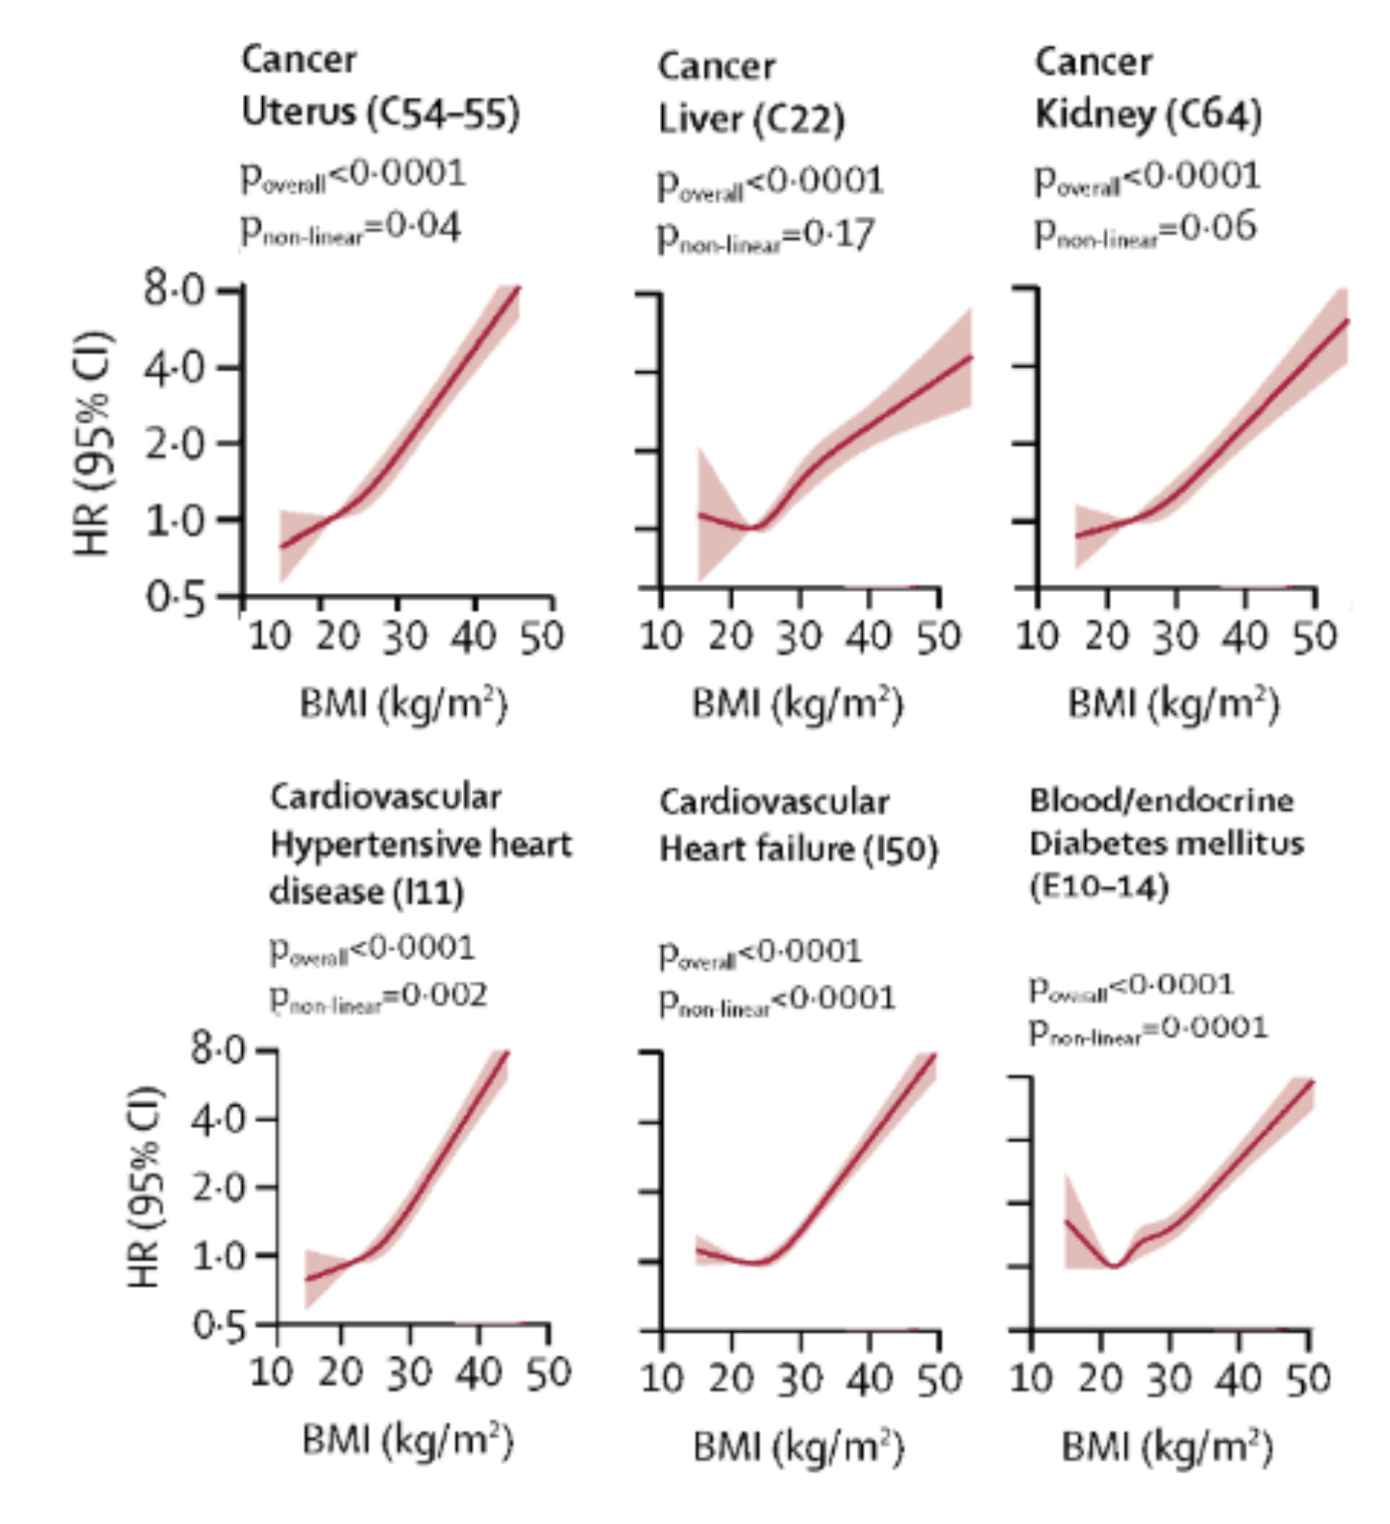
Figure 2. Select BMI and Cause-specific Mortality Hazard Ratio Graphs. Adapted from “Association of BMI with overall and cause-specific mortality: a population-based cohort study of 3·6 million adults in the UK,” by K. Bhaskaran, 2018, The Lancet Diabetes & Endocrinology, Volume 6 (Issue 12), 944 - 953.
Hazard ratio comparison for adults who never smoked, BMI > 30 kg/m2 versus healthy BMI [5]:
- Uterus Cancer: 272% increase in mortality (HR, 2.72)
- Liver Cancer: 85% Increase in mortality (HR, 1.85)
- Kidney Cancer: 67% Increase in mortality (HR, 1.67)
- Hypertensive Heart Disease: 276% Increase in mortality (HR, 2.76)
- Heart Failure: 77% Increase in mortality (HR, 1.77)
- Diabetes: 79% Increase in mortality (HR, 1.79)
Challenges in Applying BMI Universally
BMI is an effective tool for assessing risk among large groups; however, controversy remains, as its efficacy deteriorates in specific situations or when used to evaluate individuals. Physically active people who are heavily muscled are often misclassified as overweight or even obese based on BMI [16]. Similarly, certain ethnic groups or populations may require adapted BMI classification [16,17]. There is also a growing body of evidence regarding what has been described as the “BMI paradox” [18].
Consistent healthy habits, including exercise and performance training, produce innumerable adaptations throughout the body at the DNA and protein levels. BMI does not account for the diversity of physiologic, metabolic, and structural changes that result after months or years of consistent training—especially for younger exercising individuals and athletes [19, 20]. Research indicates that BMI does not correlate well with lean mass and cannot be used as a surrogate marker of body composition in athletes [21].
In a head-to-head comparison with body fat percentage measures in college-aged individuals, BMI miscategorized athletes as overweight 70–80% of the time; interestingly, even non-athletes were misclassified 40% of the time [22]. Indeed, BMI has been described as masking body composition differences between exercisers and more sedentary individuals [22]. BMI is more suited for classifying health, disease, and mortality risk in large datasets, which represent the general population—primarily non-exercisers.
BMI also does not serve diverse populations equally, as it was primarily developed based on European body types and does not account for variations in stature, muscle mass, bone density, or fat distribution across ethnic groups [17]. For example, Asian populations tend to have higher body fat percentages at lower BMIs [23, 24], leading to underestimated health risks, while Black populations often have higher lean mass at the same BMI [25], potentially overestimating obesity-related risks.
A World Health Organization (WHO) expert consultation panel recommended a lower BMI cutoff for obesity in Asian people of ≥27.5 kg/m2 instead of ≥30.0 kg/m2, whereas recommended cutoffs as low as ≥25.0 kg/m2 can be found in the literature [26,27]. Despite BMI’s origin as a simple universal index for classifying health based upon height and weight in males and females, current evidence reveals BMI may not be an ideal single metric for determining longevity, as it fails to capture the complex interplay between genetics, body composition, and metabolic health across diverse populations.
Recent meta-analyses have raised questions about the so-called “obesity paradox,” wherein higher BMI appears to confer a survival advantage in older adults [28] and in populations with certain chronic diseases [29]. The obesity paradox may partially reflect BMI’s inability to account for metabolic health, body composition, and physical fitness, which can lead to inaccurate predictions about health risk and mortality.
In fact, some researchers argue that the term "obesity paradox" is really a product of misclassification and should instead be reframed as the “BMI paradox” [18,29]. Nevertheless, BMI is still heavily relied upon to classify health status, guide medication management, and inform healthcare decision-making.
For example, with a BMI of >30 kg/m², and without known blood glucose or blood pressure measurements, a clinician or exercise physiologist may consider those metrics as risk factors outside the healthy range—but not when BMI is <30 kg/m² [30].
In other situations, if your BMI is under 30 kg/m², you may not be offered medications or treatments, or your coverage could be limited—even withheld [31]—which potentially creates a disparity for those groups or individuals who have lower BMI but higher body fat percentage, and therefore might benefit from treatment even when their BMI is below the traditional obesity threshold.
BMI alone fails to differentiate between fat mass and lean mass, which play distinct roles in longevity [32,33]. For example, older adults with higher lean body mass but an elevated BMI due to muscle rather than fat often have better health and longevity outcomes [32,33]. Conversely, individuals with normal BMI but high visceral fat—a condition sometimes referred to as “normal-weight obesity” (NWO)—may have a significantly elevated risk of metabolic disorders, morbidity, and early mortality [31]. This discrepancy further underscores the limitations of BMI as a standalone marker for predicting longevity.
Recent research appears to be reaching a consensus, highlighting the need for a shift toward more representative models of health and longevity. The American Medical Association adopted a new policy in 2023 supporting the removal of BMI as a standard measure in medicine, in large part because of heterogeneity across racial/ethnic groups, sexes, genders, and age groups [34]. The Opportunity for a More Representative Model Amidst a New Era of Weight Loss Medications
The time for a reliable and accessible metric that can act as a more suitable proxy for body composition assessments is now. The landscape of obesity management is undergoing a seismic shift with the arrival and success of GLP-1 receptor agonists (e.g., semaglutide and tirzepatide). These medications have demonstrated significant efficacy in helping people reduce body weight by 10–25% in one year, in addition to improvements in metabolic health markers [35,36].
These drugs also highlight limitations of BMI as a measure of health, in that it does not provide detailed evidence pertaining to changes in body composition, including lean mass—both of which have become recent points of emphasis in the context of GLP-1–induced weight loss [37,38,39], particularly sustainable weight loss [40].
These data heighten concerns about muscle preservation, long-term metabolic health, and potential for weight regain, since lean mass is tightly linked with resting metabolic rate (RMR) [43]. A decrease in body mass contributes to a lower metabolic rate because muscle is more metabolically active than fat. Each pound of muscle mass lost reduces RMR by approximately 6 kcal/day, whereas fat mass loss reduces RMR by just under 2 kcal/day [44]. Greater decreases in RMR associated with loss of lean mass make weight loss maintenance significantly more challenging [45].
Unfortunately, unlike fat mass—which is often replenished after meaningful weight loss, within 12 months—lean mass lost when total body weight is reduced is rarely rebuilt. Muscle building, or rebuilding, is a slow, laborious process requiring proper nutrition and exercise stimulus, especially in adults or older individuals. Research indicates that in ideal situations, where nutrition and exercise are tightly controlled, muscle mass gain occurs at a rate of 1–2 pounds per month [46,47].
According to previous research in which muscle cross-sectional area was measured, muscle mass increases are indeed slow, reported as 0.31 lbs over an 11-week intervention [48]. Muscle is considered one of the most important—if not the most important—organs of longevity [49], yet BMI does not adequately differentiate lean mass, limiting its utility for tracking the maintenance and growth of healthy muscle tissue as a critical component of human longevity.
Among pharmaceutical interventions, SGLT-2 inhibitors have emerged as potentially powerful tools for enhancing metabolic health without compromising muscle mass. These medications work by inhibiting glucose reabsorption in the kidneys, promoting glycosuria (glucose excretion in urine) and thereby lowering blood sugar levels. SGLT2 inhibitors work by blocking the SGLT2 protein in the kidneys responsible for reabsorbing glucose from the urine back into the bloodstream.
By inhibiting SGLT2, these medications increase the excretion of glucose through the urine, effectively lowering blood glucose levels – Notably, it has been estimated that SGLT2 inhibitors can result in up to 70-90 grams of glucose being excreted in your urine per day [96], which is equivalent to the sugar content of 24 oz of Coca Cola. However, their benefits extend far beyond glucose control and weight reduction.
Unlike some weight loss interventions, SGLT-2 inhibitors do not disproportionately affect lean body mass. This preservation is in contrast to GLP-1 receptor agonists, which can lead to increased caloric intake reductions that reduce total protein intake, potentially resulting in muscle wasting. SGLT-2 inhibitors do not suppress appetite and therefore lead to a reduction in protein intake. By not reducing amino acid intake, SGLT-2 inhibitor therapies preserve lean muscle mass—a critical component of metabolic and physical health. This preservation helps sustain long-term energy balance and systemic resilience by maintaining muscle synthesis and repair.
The SUSTAIN 8 trial, published in Diabetologia, offers valuable insights into the comparative effects of the SGLT-2 inhibitor Canagliflozin (300 mg) and the GLP-1 receptor agonist Semaglutide (1.0 mg) over 52 weeks in patients with uncontrolled type 2 diabetes. Both therapies produced significant improvements in HbA1c and body weight, with Semaglutide achieving a slightly greater reduction in HbA1c (-1.5%) compared to Canagliflozin (-1.0%) and superior weight loss (-5.3 kg vs. -4.2 kg, respectively). [96] HbA1c reflects long-term blood glucose control, serving as a key indicator of diabetes management and risk reduction for complications. Similarly, weight loss is a pivotal factor in improving insulin sensitivity and reducing the strain on cardiovascular and metabolic systems.
The trial’s DXA substudy (dual-energy X-ray absorptiometry) provided detailed insights into body composition changes, revealing notable differences in the quality of weight loss achieved by the two therapies. While both treatments effectively reduced fat mass—with Semaglutide achieving a slightly greater reduction (-3.4 kg vs. -2.6 kg for Canagliflozin)—Canagliflozin emerged as the more favorable option due to its superior ability to preserve lean mass. This preservation is particularly significant because lean mass, especially skeletal muscle, serves as a critical metabolic reserve, supporting glucose buffering and basal metabolic rate. By safeguarding this essential tissue, Canagliflozin may mitigate risks associated with metabolic slowdown and long-term physical decline.
While both groups experienced some absolute loss of lean mass, Canagliflozin preserved a higher proportion of lean mass relative to total weight loss. The greater lean mass loss observed with Semaglutide, although offset by its fat reduction, raises concerns about potential long-term metabolic consequences. As we've stressed, the loss of lean mass can contribute to a decline in basal metabolic rate, a phenomenon often referred to as "metabolic slowdown," which may predispose individuals to weight regain. [96]
While SGLT2 inhibitors represent a potential muscle-sparing alternative to GLP-1 receptor agonists, the meteoric rise of these medications presents an opportunity to refine how we assess individual health beyond BMI. Accessible alternatives may exist that provide better markers for lean mass and fat mass—metrics that correlate more closely with metabolic health improvements and more nuanced longevity benefits. An alternative index, or a complementary combination of metrics, may enable individuals and healthcare providers to ensure that weight loss efforts prioritize functional health gains and longevity rather than nonspecific weight loss.
What Alternatives Might Outperform BMI?
Given the growing recognition of BMI's limitations, researchers and clinicians have explored many alternative indices that may provide more information about overall health status and longevity potential. Plenty of alternative measurements and novel indices may be used in place of, or in addition to, BMI to improve predictive accuracy for determining obesity, disease risk, and healthspan at the individual level.
Obesity, a state of excessive accumulation of body fat, is an important risk factor for multiple chronic pathologies including diabetes, coronary artery disease, hypertension and certain types of cancer [50]. The definition of obesity has changed over the last century. Currently, BMI ≥30 kg/m2 is the criterion used to define obesity [1]. However, many options exist that have the potential to work synergistically or in place of BMI.
One large reason BMI remains the international standard is the ease with which it can be calculated. BMI requires only weight and height. Ten viable alternatives to BMI are presented in rank order based upon strength of research evidence and accessibility factors pertaining to equipment, measurement, and calculations (Table 1). In addition to the 10 alternatives presented below, there are other validated metrics described throughout the research literature. In an attempt to focus our analysis on metrics that share desirable simplicity and accessibility traits, like BMI, we have excluded indices that rely upon invasive procedures or blood biomarkers in this review.
Alternative Metrics:
1. Waist Circumference (WC)
WC = Direct measurement of waist circumference (inches or centimeters)
Threshold: Women = 35 inches (≥88 cm) | Men 40 inches (≥102 cm) in men
Waist circumference is a superior metric to BMI because it serves as a validated proxy for measuring central adiposity [52]. Unlike BMI, which fails to distinguish between fat mass and muscle mass, waist circumference is a surrogate for visceral fat, a key driver of conditions like type 2 diabetes, cardiovascular disease, and metabolic syndrome [53]. Studies have shown that individuals with excess abdominal fat (and subsequent higher waist circumference) are at a higher risk for early mortality, regardless of their BMI category [52,53,54,55,56]. Waist circumference is a simple, cost-effective measure that provides better predictive power for health outcomes than BMI alone, in addition to being more appropriate in diverse ethnic groups [55].
2. Waist to Height Ratio (WHtR)
WHtR = Waist circumference divided by height (inches or centimeters)
Threshold: 0.5 can be used as a universal cut-off point
Waist-to-height ratio is a superior predictor of cardiometabolic and mortality risk in head-to-head comparison with BMI [56,57,58]. WHtR >0.5 reflects an increased accumulation of visceral fat, which is strongly linked to insulin resistance, cardiovascular disease, and reduced lifespan [57,58]. WHtR, in particular, has gained recognition as a simple yet effective tool for assessing metabolic health [57,58] and longevity outcomes [59] above and beyond BMI or other waist circumference indices. In addition, the consensus WHtR cutoff of 0.5 can be used in different sex and ethnic groups and is generally accepted as a universal cutoff for central obesity in children (aged ≥6 years) through adulthood [58].
3. Waist-to-hip ratio (WHR)
WHR = Waist circumference divided by hip circumference
Threshold: Women = 0.85 | Men = 0.90, WHR >1.0 for either sex signals higher risk
Unlike BMI, which only considers total body weight relative to height, WHR distinguishes between visceral fat (around the abdomen) and subcutaneous fat (around the hips and thighs) [60]. Visceral fat is more closely linked to insulin resistance, cardiovascular disease, and other metabolic disorders, making waist circumference indices—including WHR—a better indicator of overall health risk [57].
Data in Australian adults aged 20 to 69 years suggested that WHR [60] is a superior metric to BMI because it was a stronger predictor of all-cause mortality [61]. WHR also provides a clearer picture of body fat distribution, which is a better predictor of metabolic health and disease risk than nonspecific body mass [57,60]. WHR maintains utility across different body types and muscle compositions, whereas BMI often misclassifies heavily muscled individuals as overweight or obese [22]. Interestingly, one study reported that body fat percentage measurements did not add to the prediction of mortality or CVD risk in middle-aged and older adults compared with the synergistic combination of BMI and WHR [62].
4. Body Fat Percentage (BF%)
BF% = Measure (or estimate) of fat mass divided by total body mass
Threshold: Women = 42% | Men = 30%
Unlike BMI, which assumes a correlation between total body weight relative to height and fatness, body fat percentage provides a direct measure of adiposity. Methods such as dual-energy X-ray absorptiometry (DEXA), bioelectrical impedance analysis (BIA), and skinfold calipers can estimate BF% with varying accuracy [63].
Dual-energy X-ray absorptiometry (DEXA) is widely regarded as the gold standard for body composition assessment, while BIA is more accessible, as it is built into many affordable, commercially available body weight scales [64]. Studies suggest that excessive body fat—particularly visceral fat—is more strongly associated with metabolic disease and mortality risk than BMI or total BF% [65].
A range of body fat percentage (BF%) thresholds has been used to classify obesity. Published thresholds vary between 20–25% for men and 30–37% for women [66]. In 2024, researchers at the U.S. Army Research Institute of Environmental Medicine defined clinically relevant "overweight" as 25% BF for men and 36% BF for women, and "obesity" as 30% and 42%, respectively [67].
Body fat percentage is a direct measure; however, strong consensus on predicting health risk and mortality based on threshold values will require further research [66,67]. Accessibility remains a challenge, as cost, specialized equipment, and training required to accurately measure it (as in the case of skinfold measurements) impacts its overall utility as a longevity metric.
5. Relative Fat Mass (RFM)
RFM = 64 −(20 × height/waist circumference) + (12 × sex) | Female = 1 , Male = 0
Threshold: Women = 40% | Men = 30% (Meant to fit with BF% classification)
The relative fat mass (RFM) formula was first published in 2018 by researchers Woolcott and Bergman, using data from the National Health and Nutrition Examination Survey (NHANES) between 1999 and 2004 [68]. RFM is positioned as an alternative to BMI that acts as a proxy for body fat percentage [68,69].
Compared with BMI, RFM better predicted whole-body fat percentage, measured by dual-energy X-ray absorptiometry (DXA), among women and men [68]. RFM showed better accuracy than BMI and had fewer false-negative cases of body fat–defined obesity among women and men [70]. When coupled with additional metrics such as predicted body composition, RFM outperforms BMI and waist circumference (WC) measurement [71].
RFM maintains accuracy among diverse population samples, demonstrating reduced total obesity misclassification among women and men of different ethnicities, including Mexican-Americans, European-Americans, and African-Americans [68]. RFM is an accessible alternative to BMI and has better performance across diverse population groups. Continued research will be important to strengthen the evidence base for this promising BMI alternative.
6. Body Roundness Index (BRI)
BRI = 364.2 − 365.5 × {1 − [(WC/2π)/(0.5 × height)]2}0.5
Threshold: Target BRI range = 3.4 - 5.45
The Body Roundness Index (BRI) was developed in 2013 by researcher Diana Thomas and colleagues, who introduced it as a new anthropometric measure that combines height and waist circumference to better predict body fat distribution and overall body shape [72]. Compared with BMI, BRI essentially quantifies the human body as a two-dimensional elliptical shape [72]. BRI also includes a waist circumference measurement and therefore incorporates a measure of visceral adiposity.
BRI data indicates it may be a good predictor of hypertension [73], non-alcoholic fatty liver disease [74], and metabolic syndrome in both men and women of diverse nationalities and ethnic groups [75]. In 2024, BRI was evaluated in relation to all-cause mortality; like BMI, there was a U-shaped relationship between BRI and mortality among adults [76,77]. BRI is another popular index that presents a viable alternative or adjunct to BMI for assessing health, disease risk, and longevity.
7. Body Shape Index (ABSI)
ABSI = WC/(BMI2/3 × Height1/2)
Threshold: ABSIz-score < -0.868 signals very low risk
The Body Shape Index (ABSI) was developed using data from the United States National Health and Nutrition Examination Survey (NHANES) conducted between 1999 and 2004. Introduced in 2012, ABSI was designed to quantify abdominal obesity and better predict disease risk [78].
ABSI is a metric used to assess body fat distribution and the risk of chronic diseases. It has been associated with all-cause mortality, metabolic syndrome, diabetes, and hypertension [73, 79, 80, 81]. A 2020 comparison of twelve waist circumference indices concluded that ABSI was the best complementary pairing with BMI for mortality risk stratification [82].
Although ABSI has demonstrated positive associations with morbidity and mortality, the equation and interpretation of both the raw score and z-score lacks simplicity relative to other alternative indices.
8. Fat Mass Index (FMI)
FMI = fat mass divided by height2
Threshold: FMI < 7.3 kg/m2
Fat mass index was first introduced in 1990 [83]. FMI adjusts fat mass relative to height and provides a more individualized assessment of adiposity compared to BMI [84,85]. It is considered superior to using body fat percentage alone because it accounts for height, offering a more accurate representation of fat distribution relative to body size [83,86].
The overall utility and accessibility of FMI are limited by the need for a body composition or fat mass measurement, followed by an additional calculation to produce the index value. FMI has a J-shaped association with mortality based on prospective study data for individuals under 65 years old, while a positive linear relationship is observed for those aged 65 and older [87]. Prospective cohort data showed a 50% increase in mortality risk, based on hazard ratios, as FMI increased from low to high [87].
9. Lean Mass Index (LMI)
LMI = lean mass divided by height2
Threshold: LMI > 16.0 kg/m2
Lean Mass Index (LMI), also known as Fat-Free Mass Index (FFMI), was introduced alongside FMI in 1990 [83]. LMI has a reverse J-shaped curve associated with mortality based on prospective study data for individuals under 65 years old, while a negative linear relationship is observed for individuals aged 65 and older [87]. According to results from seven prospective cohort studies, high LMI was associated with a 30% reduction in mortality risk [87]. A 2010 research study demonstrated higher lean mass index was associated with better survival than low BMI suggesting LMI may have additional value as an index that correlates with longevity in select population subgroups [88].
10. Body Adiposity Index (BAI)
BAI = ((hip circumference)/((height)(1.5))-18))
Threshold: Women = 40% | Men = 30% (Meant to fit with BF% classification)
The Body Adiposity Index (BAI) was developed and first published in 2011 [89]. BAI may be used to reflect percent body fat for adult women and men [89,90]. A 2018 systematic review concluded that BAI is not recommended as a marker for body fatness in adults [91] and further studies are needed to evaluate BAI’s association with adverse health effects [92]. BAI may function as a measure of overall adiposity, but it is unlikely to outperform BMI, as some data reveal it does not serve different ethnicities effectively [93, 94].
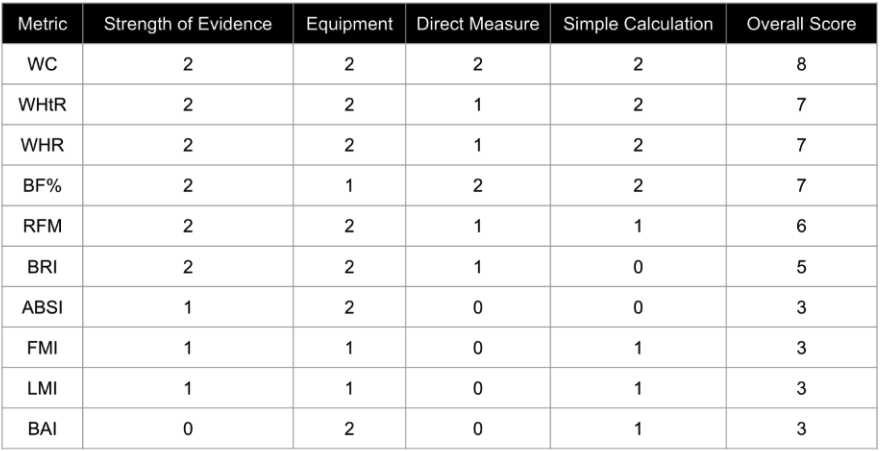
Table 1. Ranked Alternatives to BMI. Each category was rated as 0, 1, or 2. Overall score is the sum total of all four categories. WC = Waist Circumference, WHtR = Waist to Height Ratio, WHR = Waist to Hip Ratio, BF% = Body Fat Percentage, RFM = Relative Fat Mass, BRI = Body Roundness Index, ABSI = Body Shape Index, BAI = Body Adiposity Index, FMI = Fat Mass Index, LMI = Lean Mass Index
Our analysis of BMI alternative indices produced several key findings. First, six out of ten of the alternative indices evaluated rely on a waist circumference measurement. Indices that incorporate waist circumference clearly meet the criteria for simplicity and accessibility. They also offer added value, as waist circumference is considered a reliable proxy for visceral adiposity—a known risk factor for chronic age-related diseases, which are leading causes of death in humans.
Another key finding, based on our review of the literature, is that the majority of these indices can be calculated using simple inputs and just one or two basic tools. The first is a flexible, non-elastic tape measure—or even a piece of string or rope—to measure circumference and height. The second is a body weight scale. Like BMI, which is positioned as the international standard in part due to its simplicity, accessibility, and robust epidemiological data, most of the top-performing indices in the literature also meet these criteria. Many continue to amass supporting data, often demonstrating superior performance in head-to-head comparisons, or functioning as complementary additions to BMI for predicting health and longevity outcomes.
Overall, considering the ease with which indices such as WC, WHtR, and RFM can be calculated from waist circumference and height measurements, leveraging several indices in addition to BMI might provide a more comprehensive picture of health.
In January of this year, 2025, the International Journal of Surgery published a cross-sectional study in which clinician-researchers utilized nine different obesity-related indices to predict gallstone risk in over 3,654 participants from the National Health and Nutrition Examination Survey (NHANES) dataset for the 2017–2020 cycle [95]. Dr. Wu and colleagues used weighted logistic regression analyses to determine which indices were most predictive of gallstones [95].
With a multitude of reliable alternative indices available, it is time to consider complementing—or even replacing—isolated BMI with a strategic blend or constellation of accessible, powerful alternative indices for classification of individual health and longevity.
Conclusion
Persistent reliance on BMI as a primary health classification metric has led to oversimplifications that do not adequately serve individuals. While BMI remains useful for large-scale epidemiological studies, its limitations make it inadequate for personalizing health recommendations, monitoring, and predicting longevity with precision.
A shift toward models that measure or estimate body composition, abdominal adiposity, and/or muscle mass provides enhanced information for assessing healthspan and longevity. As new weight loss medications reshape how we approach obesity treatment, this transition offers a timely opportunity to clearly define what successful and sustainable weight management truly looks like. In the pursuit of longevity, precision matters, and it's time standard health metrics reflect that reality.
BMI is one of many important metrics that can be used to determine health and longevity. As such it should be paired with alternative indices as part of a more comprehensive quantification of longevity markers that are accessible, predictive, and appropriate for diverse populations as the global focus on improving longevity continue to grow.
- Sorkin J. D. (2014). BMI, age, and mortality: the slaying of a beautiful hypothesis by an ugly fact. The American journal of clinical nutrition, 99(4), 759–760.
- PARNELL R. W. (1954). Somatotyping by physical anthropometry. American journal of physical anthropology, 12(2), 209–239.
- Andres R. (1980). The obesity-mortality association: where is the nadir of the U-shaped curve?. Transactions of the Association of Life Insurance Medical Directors of America, 64, 185–197.
- Weir, C. B., & Jan, A. (2023). BMI Classification Percentile And Cut Off Points. In StatPearls. StatPearls Publishing.
- Bhaskaran, K., Dos-Santos-Silva, I., Leon, D. A., Douglas, I. J., & Smeeth, L. (2018). Association of BMI with overall and cause-specific mortality: a population-based cohort study of 3·6 million adults in the UK. The lancet. Diabetes & endocrinology, 6(12), 944–953.
- Borrell, L. N., & Samuel, L. (2014). Body mass index categories and mortality risk in US adults: the effect of overweight and obesity on advancing death. American journal of public health, 104(3), 512–519.
- Faeh, D., Braun, J., Tarnutzer, S., & Bopp, M. (2011). Obesity but not overweight is associated with increased mortality risk. European journal of epidemiology, 26(8), 647–655.
- GBD 2015 Obesity Collaborators, Afshin, A., Forouzanfar, M. H., Reitsma, M. B., Sur, P., Estep, K., Lee, A., Marczak, L., Mokdad, A. H., Moradi-Lakeh, M., Naghavi, M., Salama, J. S., Vos, T., Abate, K. H., Abbafati, C., Ahmed, M. B., Al-Aly, Z., Alkerwi, A., Al-Raddadi, R., Amare, A. T., … Murray, C. J. L. (2017). Health Effects of Overweight and Obesity in 195 Countries over 25 Years. The New England journal of medicine, 377(1), 13–27.
- Winter, J. E., MacInnis, R. J., Wattanapenpaiboon, N., & Nowson, C. A. (2014). BMI and all-cause mortality in older adults: a meta-analysis. The American journal of clinical nutrition, 99(4), 875–890.
- Javed, A. A., Aljied, R., Allison, D. J., Anderson, L. N., Ma, J., & Raina, P. (2020). Body mass index and all-cause mortality in older adults: A scoping review of observational studies. Obesity reviews : an official journal of the International Association for the Study of Obesity, 21(8), e13035.
- Prospective Studies Collaboration, Whitlock, G., Lewington, S., Sherliker, P., Clarke, R., Emberson, J., Halsey, J., Qizilbash, N., Collins, R., & Peto, R. (2009). Body-mass index and cause-specific mortality in 900 000 adults: collaborative analyses of 57 prospective studies. Lancet (London, England), 373(9669), 1083–1096.
- Secord, A. A., Hasselblad, V., Von Gruenigen, V. E., Gehrig, P. A., Modesitt, S. C., Bae-Jump, V., & Havrilesky, L. J. (2016). Body mass index and mortality in endometrial cancer: A systematic review and meta-analysis. Gynecologic oncology, 140(1), 184–190.
- Sohn, W., Lee, H. W., Lee, S., Lim, J. H., Lee, M. W., Park, C. H., & Yoon, S. K. (2021). Obesity and the risk of primary liver cancer: A systematic review and meta-analysis. Clinical and molecular hepatology, 27(1), 157–174.
- Dwivedi, A. K., Dubey, P., Cistola, D. P., & Reddy, S. Y. (2020). Association Between Obesity and Cardiovascular Outcomes: Updated Evidence from Meta-analysis Studies. Current cardiology reports, 22(4), 25.
- Aune, D., Sen, A., Norat, T., Janszky, I., Romundstad, P., Tonstad, S., & Vatten, L. J. (2016). Body Mass Index, Abdominal Fatness, and Heart Failure Incidence and Mortality: A Systematic Review and Dose-Response Meta-Analysis of Prospective Studies. Circulation, 133(7), 639–649.
- Bogin, B., & Varela-Silva, M. I. (2012). The body mass index: the good, the bad, and the horrid. Bull Soc Suisse Anthropol, 18(2), 5-11.
- Stommel, M., & Schoenborn, C. A. (2010). Variations in BMI and prevalence of health risks in diverse racial and ethnic populations. Obesity (Silver Spring, Md.), 18(9), 1821–1826.
- Antonopoulos, A. S., Oikonomou, E. K., Antoniades, C., & Tousoulis, D. (2016). From the BMI paradox to the obesity paradox: the obesity-mortality association in coronary heart disease. Obesity reviews : an official journal of the International Association for the Study of Obesity, 17(10), 989–1000.
- Mazic, S., Djelic, M., Suzic, J., Suzic, S., Dekleva, M., Radovanovic, D., Scepanovic, L., & Starcevic, V. (2009). Overweight in trained subjects - are we looking at wrong numbers? (Body mass index compared with body fat percentage in estimating overweight in athletes.). General physiology and biophysics, 28 Spec No, 200–204.
- Executive summary of the clinical guidelines on the identification, evaluation, and treatment of overweight and obesity in adults. (1998). Archives of internal medicine, 158(17), 1855–1867.
- Garrido-Chamorro, R. P., Sirvent-Belando, J. E., Gonzalez-Lorenzo, M., Martin-Carratala, M. L., & Roche, E. (2009). Correlation between body mass index and body composition in elite athletes. The Journal of sports medicine and physical fitness, 49(3), 278–284.
- Ode, J. J., Pivarnik, J. M., Reeves, M. J., & Knous, J. L. (2007). Body mass index as a predictor of percent fat in college athletes and nonathletes. Medicine and science in sports and exercise, 39(3), 403–409.
- Li, Z., Daniel, S., Fujioka, K., & Umashanker, D. (2023). Obesity among Asian American people in the United States: A review. Obesity (Silver Spring, Md.), 31(2), 316–328.
- Zierle-Ghosh A, Jan A. Physiology, Body Mass Index. [Updated 2023 Nov 5]. In: StatPearls [Internet]. Treasure Island (FL): StatPearls Publishing; 2025 Jan-. Available from: https://www.ncbi.nlm.nih.gov/books/NBK535456/
- Rahman, M., & Berenson, A. B. (2010). Accuracy of current body mass index obesity classification for white, black, and Hispanic reproductive-age women. Obstetrics and gynecology, 115(5), 982–988.
- WHO Expert Consultation (2004). Appropriate body-mass index for Asian populations and its implications for policy and intervention strategies. Lancet (London, England), 363(9403), 157–163.
- James, W. P., Chunming, C., & Inoue, S. (2002). Appropriate Asian body mass indices?. Obesity reviews : an official journal of the International Association for the Study of Obesity, 3(3), 139. https://doi.org/10.1046/j.1467-789x.2002.00063.x
- Liu, C., Wong, P. Y., Chung, Y. L., Chow, S. K., Cheung, W. H., Law, S. W., Chan, J. C. N., & Wong, R. M. Y. (2023). Deciphering the "obesity paradox" in the elderly: A systematic review and meta-analysis of sarcopenic obesity. Obesity reviews : an official journal of the International Association for the Study of Obesity, 24(2), e13534.
- Donini, L. M., Pinto, A., Giusti, A. M., Lenzi, A., & Poggiogalle, E. (2020). Obesity or BMI Paradox? Beneath the Tip of the Iceberg. Frontiers in nutrition, 7, 53.
- Liguori, G., & American College of Sports Medicine. (2020). ACSM's guidelines for exercise testing and prescription. Lippincott williams & wilkins.
- Franco, L. P., Morais, C. C., & Cominetti, C. (2016). Normal-weight obesity syndrome: diagnosis, prevalence, and clinical implications. Nutrition reviews, 74(9), 558–570.
- Srikanthan, P., & Karlamangla, A. S. (2014). Muscle mass index as a predictor of longevity in older adults. The American journal of medicine, 127(6), 547–553.
- Wang, H., Hai, S., Liu, Y., Liu, Y., & Dong, B. (2019). Skeletal Muscle Mass as a Mortality Predictor among Nonagenarians and Centenarians: A Prospective Cohort Study. Scientific reports, 9(1), 2420.
- American Medical Association. (2023). Public Health Policy (updated).
- Moore, P. W., Malone, K., VanValkenburg, D., Rando, L. L., Williams, B. C., Matejowsky, H. G., Ahmadzadeh, S., Shekoohi, S., Cornett, E. M., & Kaye, A. D. (2023). GLP-1 Agonists for Weight Loss: Pharmacology and Clinical Implications. Advances in therapy, 40(3), 723–742.
- Pan, X. H., Tan, B., Chin, Y. H., Lee, E. C. Z., Kong, G., Chong, B., Kueh, M., Khoo, C. M., Mehta, A., Majety, P., Grandhi, G. R., Dimitriadis, G. K., Foo, R., Chew, N. W. S., Le Roux, C. W., Mamas, M. A., & Chan, M. Y. (2024). Efficacy and safety of tirzepatide, GLP-1 receptor agonists, and other weight loss drugs in overweight and obesity: a network meta-analysis. Obesity (Silver Spring, Md.), 32(5), 840–856.
- Tinsley, G. M., & Heymsfield, S. B. (2024). Fundamental Body Composition Principles Provide Context for Fat-Free and Skeletal Muscle Loss With GLP-1 RA Treatments. Journal of the Endocrine Society, 8(11), bvae164.
- Linge, J., Birkenfeld, A. L., & Neeland, I. J. (2024). Muscle Mass and Glucagon-Like Peptide-1 Receptor Agonists: Adaptive or Maladaptive Response to Weight Loss?. Circulation, 150(16), 1288–1298.
- Conte, C., Hall, K. D., & Klein, S. (2024). Is Weight Loss-Induced Muscle Mass Loss Clinically Relevant?. JAMA, 332(1), 9–10.
- Neeland, I. J., Linge, J., & Birkenfeld, A. L. (2024). Changes in lean body mass with glucagon-like peptide-1-based therapies and mitigation strategies. Diabetes, obesity & metabolism, 26 Suppl 4, 16–27.
- McCrimmon, R. J., Catarig, A. M., Frias, J. P., Lausvig, N. L., le Roux, C. W., Thielke, D., & Lingvay, I. (2020). Effects of once-weekly semaglutide vs once-daily canagliflozin on body composition in type 2 diabetes: a substudy of the SUSTAIN 8 randomised controlled clinical trial. Diabetologia, 63(3), 473–485.
- Jendle, J., Nauck, M. A., Matthews, D. R., Frid, A., Hermansen, K., Düring, M., Zdravkovic, M., Strauss, B. J., Garber, A. J., & LEAD-2 and LEAD-3 Study Groups (2009). Weight loss with liraglutide, a once-daily human glucagon-like peptide-1 analogue for type 2 diabetes treatment as monotherapy or added to metformin, is primarily as a result of a reduction in fat tissue. Diabetes, obesity & metabolism, 11(12), 1163–1172.
- Christoffersen, B. Ø., Sanchez-Delgado, G., John, L. M., Ryan, D. H., Raun, K., & Ravussin, E. (2022). Beyond appetite regulation: Targeting energy expenditure, fat oxidation, and lean mass preservation for sustainable weight loss. Obesity (Silver Spring, Md.), 30(4), 841–857.
- Christoffersen, B. Ø., Sanchez-Delgado, G., John, L. M., Ryan, D. H., Raun, K., & Ravussin, E. (2022). Beyond appetite regulation: Targeting energy expenditure, fat oxidation, and lean mass preservation for sustainable weight loss. Obesity (Silver Spring, Md.), 30(4), 841–857.
- Bosy-Westphal, A., Kossel, E., Goele, K., Later, W., Hitze, B., Settler, U., Heller, M., Glüer, C. C., Heymsfield, S. B., & Müller, M. J. (2009). Contribution of individual organ mass loss to weight loss-associated decline in resting energy expenditure.
- Benito, P. J., Cupeiro, R., Ramos-Campo, D. J., Alcaraz, P. E., & Rubio-Arias, J. Á. (2020). A Systematic Review with Meta-Analysis of the Effect of Resistance Training on Whole-Body Muscle Growth in Healthy Adult Males. International journal of environmental research and public health, 17(4), 1285. American journal of clinical nutrition, 90(4), 993–1001.
- Francaux, M., & Deldicque, L. (2019). Exercise and the control of muscle mass in human. Pflugers Archiv : European journal of physiology, 471(3), 397–411.
- Moquin, P. A., Wetmore, A. B., Carroll, K. M., Fry, A. C., Hornsby, W. G., & Stone, M. H. (2021). Lean Body Mass and Muscle Cross-Sectional Area Adaptations Among College Age Males with Different Strength Levels across 11 Weeks of Block Periodized Programmed Resistance Training. International journal of environmental research and public health, 18(9), 4735.
- McLeod, M., Breen, L., Hamilton, D. L., & Philp, A. (2016). Live strong and prosper: the importance of skeletal muscle strength for healthy ageing. Biogerontology, 17(3), 497–510.
- Zheng, Y., Manson, J. E., Yuan, C., Liang, M. H., Grodstein, F., Stampfer, M. J., Willett, W. C., & Hu, F. B. (2017). Associations of Weight Gain From Early to Middle Adulthood With Major Health Outcomes Later in Life. JAMA, 318(3), 255–269.
- De Lorenzo, A., Martinoli, R., Vaia, F., & Di Renzo, L. (2006). Normal weight obese (NWO) women: an evaluation of a candidate new syndrome. Nutrition, metabolism, and cardiovascular diseases : NMCD, 16(8), 513–523.
- Ross, R., Neeland, I. J., Yamashita, S., Shai, I., Seidell, J., Magni, P., Santos, R. D., Arsenault, B., Cuevas, A., Hu, F. B., Griffin, B. A., Zambon, A., Barter, P., Fruchart, J. C., Eckel, R. H., Matsuzawa, Y., & Després, J. P. (2020). Waist circumference as a vital sign in clinical practice: a Consensus Statement from the IAS and ICCR Working Group on Visceral Obesity. Nature reviews. Endocrinology, 16(3), 177–189.
- Janssen, I., Katzmarzyk, P. T., & Ross, R. (2004). Waist circumference and not body mass index explains obesity-related health risk. The American journal of clinical nutrition, 79(3), 379–384.
- Cerhan, J. R., Moore, S. C., Jacobs, E. J., Kitahara, C. M., Rosenberg, P. S., Adami, H. O., Ebbert, J. O., English, D. R., Gapstur, S. M., Giles, G. G., Horn-Ross, P. L., Park, Y., Patel, A. V., Robien, K., Weiderpass, E., Willett, W. C., Wolk, A., Zeleniuch-Jacquotte, A., Hartge, P., Bernstein, L., … Berrington de Gonzalez, A. (2014). A pooled analysis of waist circumference and mortality in 650,000 adults. Mayo Clinic proceedings, 89(3), 335–345.
- Lear, S. A., James, P. T., Ko, G. T., & Kumanyika, S. (2010). Appropriateness of waist circumference and waist-to-hip ratio cutoffs for different ethnic groups. European journal of clinical nutrition, 64(1), 42–61.
- Nevill, A. M., Duncan, M. J., & Myers, T. (2022). BMI is dead; long live waist-circumference indices: But which index should we choose to predict cardio-metabolic risk?. Nutrition, metabolism, and cardiovascular diseases : NMCD, 32(7), 1642–1650.
- Yoo E. G. (2016). Waist-to-height ratio as a screening tool for obesity and cardiometabolic risk. Korean journal of pediatrics, 59(11), 425–431.
- Ashwell, M., Gunn, P., & Gibson, S. (2012). Waist-to-height ratio is a better screening tool than waist circumference and BMI for adult cardiometabolic risk factors: systematic review and meta-analysis. Obesity reviews : an official journal of the International Association for the Study of Obesity, 13(3), 275–286.
- Abdi Dezfouli, R., Mohammadian Khonsari, N., Hosseinpour, A., Asadi, S., Ejtahed, H. S., & Qorbani, M. (2023). Waist to height ratio as a simple tool for predicting mortality: a systematic review and meta-analysis. International journal of obesity (2005), 47(12), 1286–1301.
- Seidell J. C. (2010). Waist circumference and waist/hip ratio in relation to all-cause mortality, cancer and sleep apnea. European journal of clinical nutrition, 64(1), 35–41.
- Welborn, T. A., & Dhaliwal, S. S. (2007). Preferred clinical measures of central obesity for predicting mortality. European journal of clinical nutrition, 61(12), 1373–1379.
- Myint, P. K., Kwok, C. S., Luben, R. N., Wareham, N. J., & Khaw, K. T. (2014). Body fat percentage, body mass index and waist-to-hip ratio as predictors of mortality and cardiovascular disease. Heart (British Cardiac Society), 100(20), 1613–1619.
- Golja, P., Robič Pikel, T., Zdešar Kotnik, K., Fležar, M., Selak, S., Kapus, J., & Kotnik, P. (2020). Direct Comparison of (Anthropometric) Methods for the Assessment of Body Composition. Annals of nutrition & metabolism, 76(3), 183–192.
- Lang, P. O., Trivalle, C., Vogel, T., Proust, J., Papazyan, J. P., & Dramé, M. (2015). Determination of Cutoff Values for DEXA-Based Body Composition Measurements for Determining Metabolic and Cardiovascular Health. BioResearch open access, 4(1), 16–25.
- Britton, K. A., Massaro, J. M., Murabito, J. M., Kreger, B. E., Hoffmann, U., & Fox, C. S. (2013). Body fat distribution, incident cardiovascular disease, cancer, and all-cause mortality. Journal of the American College of Cardiology, 62(10), 921–925.
- Oliveros, E., Somers, V. K., Sochor, O., Goel, K., & Lopez-Jimenez, F. (2014). The concept of normal weight obesity. Progress in cardiovascular diseases, 56(4), 426–433.
- Potter, A. W., Chin, G. C., Looney, D. P., & Friedl, K. E. (2024). Defining Overweight and Obesity by Percent Body Fat instead of Body Mass Index. The Journal of clinical endocrinology and metabolism, dgae341. Advance online publication.
- Woolcott, O. O., & Bergman, R. N. (2018). Relative fat mass (RFM) as a new estimator of whole-body fat percentage ─ A cross-sectional study in American adult individuals. Scientific reports, 8(1), 10980.
- Kobo, O., Leiba, R., Avizohar, O., & Karban, A. (2019). Relative fat mass is a better predictor of dyslipidemia and metabolic syndrome than body mass index. Cardiovascular endocrinology & metabolism, 8(3), 77–81.
- Corrêa, C. R., Formolo, N. P. S., Dezanetti, T., Speretta, G. F. F., & Nunes, E. A. (2021). Relative fat mass is a better tool to diagnose high adiposity when compared to body mass index in young male adults: A cross-section study. Clinical nutrition ESPEN, 41, 225–233.
- Cichosz, S. L., Rasmussen, N. H., Vestergaard, P., & Hejlesen, O. (2022). Is predicted body-composition and relative fat mass an alternative to body-mass index and waist circumference for disease risk estimation?. Diabetes & metabolic syndrome, 16(9), 102590.
- Thomas, D. M., Bredlau, C., Bosy-Westphal, A., Mueller, M., Shen, W., Gallagher, D., Maeda, Y., McDougall, A., Peterson, C. M., Ravussin, E., & Heymsfield, S. B. (2013). Relationships between body roundness with body fat and visceral adipose tissue emerging from a new geometrical model. Obesity (Silver Spring, Md.), 21(11), 2264–2271.
- Calderón-García, J. F., Roncero-Martín, R., Rico-Martín, S., De Nicolás-Jiménez, J. M., López-Espuela, F., Santano-Mogena, E., Alfageme-García, P., & Sánchez Muñoz-Torrero, J. F. (2021). Effectiveness of Body Roundness Index (BRI) and a Body Shape Index (ABSI) in Predicting Hypertension: A Systematic Review and Meta-Analysis of Observational Studies. International journal of environmental research and public health, 18(21), 11607.
- Motamed, N., Rabiee, B., Hemasi, G. R., Ajdarkosh, H., Khonsari, M. R., Maadi, M., Keyvani, H., & Zamani, F. (2016). Body Roundness Index and Waist-to-Height Ratio are Strongly Associated With Non-Alcoholic Fatty Liver Disease: A Population-Based Study. Hepatitis monthly, 16(9), e39575.
- Rico-Martín, S., Calderón-García, J. F., Sánchez-Rey, P., Franco-Antonio, C., Martínez Alvarez, M., & Sánchez Muñoz-Torrero, J. F. (2020). Effectiveness of body roundness index in predicting metabolic syndrome: A systematic review and meta-analysis. Obesity reviews : an official journal of the International Association for the Study of Obesity, 21(7), e13023.
- Zhang, X., Ma, N., Lin, Q., Chen, K., Zheng, F., Wu, J., Dong, X., & Niu, W. (2024). Body Roundness Index and All-Cause Mortality Among US Adults. JAMA network open, 7(6), e2415051.
- Ding, J., Chen, X., Shi, Z., Bai, K., & Shi, S. (2023). Association of body roundness index and its trajectories with all-cause and cardiovascular mortality among a Chinese middle-aged and older population: A retrospective cohort study. Frontiers in public health, 11, 1107158.
- Krakauer, N. Y., & Krakauer, J. C. (2012). A new body shape index predicts mortality hazard independently of body mass index. PloS one, 7(7), e39504.
- Ji, M., Zhang, S., & An, R. (2018). Effectiveness of A Body Shape Index (ABSI) in predicting chronic diseases and mortality: a systematic review and meta-analysis. Obesity reviews : an official journal of the International Association for the Study of Obesity, 19(5), 737–759.
- Gažarová, M., Galšneiderová, M., & Mečiarová, L. (2019). Obesity diagnosis and mortality risk based on a body shape index (ABSI) and other indices and anthropometric parameters in university students. Roczniki Panstwowego Zakladu Higieny, 70(3), 267–275.
- Baveicy, K., Mostafaei, S., Darbandi, M., Hamzeh, B., Najafi, F., & Pasdar, Y. (2020). Predicting Metabolic Syndrome by Visceral Adiposity Index, Body Roundness Index and a Body Shape Index in Adults: A Cross-Sectional Study from the Iranian RaNCD Cohort Data. Diabetes, metabolic syndrome and obesity : targets and therapy, 13, 879–887.
- Christakoudi, S., Tsilidis, K. K., Muller, D. C., Freisling, H., Weiderpass, E., Overvad, K., Söderberg, S., Häggström, C., Pischon, T., Dahm, C. C., Zhang, J., Tjønneland, A., Halkjær, J., MacDonald, C., Boutron-Ruault, M. C., Mancini, F. R., Kühn, T., Kaaks, R., Schulze, M. B., Trichopoulou, A., … Riboli, E. (2020). A Body Shape Index (ABSI) achieves better mortality risk stratification than alternative indices of abdominal obesity: results from a large European cohort. Scientific reports, 10(1), 14541.
- VanItallie, T. B., Yang, M. U., Heymsfield, S. B., Funk, R. C., & Boileau, R. A. (1990). Height-normalized indices of the body's fat-free mass and fat mass: potentially useful indicators of nutritional status. The American journal of clinical nutrition, 52(6), 953–959.
- Peltz, G., Aguirre, M. T., Sanderson, M., & Fadden, M. K. (2010). The role of fat mass index in determining obesity. American journal of human biology : the official journal of the Human Biology Council, 22(5), 639–647.
- Oliveira, B. R., Magalhães, E. I. D. S., Bragança, M. L. B. M., Coelho, C. C. N. D. S., Lima, N. P., Bettiol, H., Barbieri, M. A., Cardoso, V. C., Santos, A. M. D., Horta, B. L., & Silva, A. A. M. D. (2023). Performance of Body Fat Percentage, Fat Mass Index and Body Mass Index for Detecting Cardiometabolic Outcomes in Brazilian Adults. Nutrients, 15(13), 2974.
- Schutz, Y., Kyle, U. U., & Pichard, C. (2002). Fat-free mass index and fat mass index percentiles in Caucasians aged 18-98 y. International journal of obesity and related metabolic disorders : journal of the International Association for the Study of Obesity, 26(7), 953–960.
- Sedlmeier, A. M., Baumeister, S. E., Weber, A., Fischer, B., Thorand, B., Ittermann, T., Dörr, M., Felix, S. B., Völzke, H., Peters, A., & Leitzmann, M. F. (2021). Relation of body fat mass and fat-free mass to total mortality: results from 7 prospective cohort studies. The American journal of clinical nutrition, 113(3), 639–646.
- Han, S. S., Kim, K. W., Kim, K. I., Na, K. Y., Chae, D. W., Kim, S., & Chin, H. J. (2010). Lean mass index: a better predictor of mortality than body mass index in elderly Asians. Journal of the American Geriatrics Society, 58(2), 312–317.
- Bergman, R. N., Stefanovski, D., Buchanan, T. A., Sumner, A. E., Reynolds, J. C., Sebring, N. G., Xiang, A. H., & Watanabe, R. M. (2011). A better index of body adiposity. Obesity (Silver Spring, Md.), 19(5), 1083–1089.
- Barreira, T. V., Harrington, D. M., Staiano, A. E., Heymsfield, S. B., & Katzmarzyk, P. T. (2011). Body adiposity index, body mass index, and body fat in white and black adults. JAMA, 306(8), 828–830.
- Cerqueira, M. S., Santos, C. A. D., Silva, D. A. S., Amorim, P. R. D. S., Marins, J. C. B., & Franceschini, S. D. C. C. (2018). Validity of the Body Adiposity Index in Predicting Body Fat in Adults: A Systematic Review. Advances in nutrition (Bethesda, Md.), 9(5), 617–624.
- Jabłonowska-Lietz, B., Wrzosek, M., Włodarczyk, M., & Nowicka, G. (2017). New indexes of body fat distribution, visceral adiposity index, body adiposity index, waist-to-height ratio, and metabolic disturbances in the obese. Kardiologia polska, 75(11), 1185–1191.
- Ribeiro da Costa, J. R., da Costa, R. F., Goncalves, C. A. M., de Oliveira Borges, M. V., Almeida-Neto, P. F., De Assis, G. G., Cabral, B. G. A. T., & Dantas, P. M. S. (2022). The Body Adiposity Index is not applicable to the Brazilian adult population. Frontiers in nutrition, 9, 888507.
- Lam, B. C., Koh, G. C., Chen, C., Wong, M. T., & Fallows, S. J. (2015). Comparison of Body Mass Index (BMI), Body Adiposity Index (BAI), Waist Circumference (WC), Waist-To-Hip Ratio (WHR) and Waist-To-Height Ratio (WHtR) as predictors of cardiovascular disease risk factors in an adult population in Singapore. PloS one, 10(4), e0122985.
- Wu, X., Song, Y., & Wu, S. (2025). The development and evaluation of nine obesity-based indices for gallstones in U.S. adults. International journal of surgery (London, England), 10.1097/JS9.0000000000002237. Advance online publication.
- McCrimmon RJ, Catarig AM, Frias JP, et al. Effects of once-weekly semaglutide vs once-daily canagliflozin on body composition in type 2 diabetes: a substudy of the SUSTAIN 8 randomised controlled clinical trial. Diabetologia. 2020;63(3):473–485. doi: 10.1007/s00125-019-05065-8.
- Tawfik, DT, Bakhshi, S, SGLT-2 Inhibitors in Aging and Healthspan: Surprising Mechanistic Insights Into Adipose Tissue Reduction, Lean Mass Preservation, and Longevity. Healthspan Research Review 2025